Download
1 / 38
380 likes | 462 Vues
How do the most massive galaxies constrain theories of galaxy formation?. rachel somerville STScI. 9/27/2004 massive galaxies over cosmic time. Collaborators:. T. Dahlen, M. Dickinson, H. Ferguson, B. Mobasher, L. Moustakas, C. Papovich, and the GOODS team

E N D
How do the most massive galaxies constrain theories of galaxy formation? rachel somerville STScI 9/27/2004 massive galaxies over cosmic time
Collaborators: T. Dahlen, M. Dickinson, H. Ferguson, B. Mobasher, L. Moustakas, C. Papovich, and the GOODS team E. Bell, H.-W. Rix, C. Wolf, D. McIntosh, A. Borch and the GEMS team S. Faber, B. Allgood, J. Primack, A. Dekel…
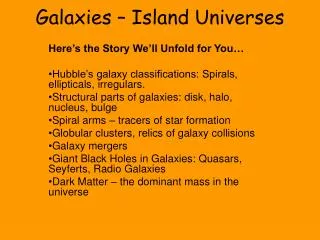
(Alledgedly) Massive Galaxies: a cosmic zoo • optical/NIR selected samples at z~0 (SDSS/2MASS) • optically selected samples at z~1 (COMBO, DEEP, VDDS, GOODS) • (deep) NIR selected samples @z~1-2 (K20, GDDS, FIRES, GOODS, …) • EROs in R-K (z~1-ish) and J-K (z~2-ish) • Lyman break galaxies (rest UV selected) @z ~ 3-6 • Sub-mm galaxies (SMG’s) @ z ~ 2 • other: radio galaxies, QSO’s, BCG’s, …
For any of these populations, we can ask: • do models produce the right number (densities) of objects? • do models produce objects with the observed properties • luminosity, color, star formation rate • stellar mass, internal velocity, clustering • radial size, morphological type (spheroidal, disk, other, etc.)
Pan-chromatic and multi-epoch Unification • ultimately, we would like to know which of these populations are ‘different parts of the same elephant’ • and which are ‘caterpillars and butterflies’ (ancestor/descendant relationships)
Science, January 2004 “These results are a long way from ruling out the paradigm of hierarchical structure formation” -rachel somerville “It’s not quite time for theorists to panic, but we’re getting there” -Roberto Abraham
Do massive galaxies at high redshift pose a crisis for CDM? local galaxies m*>2.5E10 Msun m*>1.0E11 Msun LBGs K20 EROs sub-mm these kinds of observations could refute CDM, but so far they do not pose a problem. n.b. all theorists agree on this SDSS QSOs
‘dark matter halos’: total mass baryonic mass 40% of baryons observed galaxies: stellar mass log
gastrophysics • all CDM-based models of galaxy formation introduce a non-linear relationship between DM halo mass and baryonic mass via recipes for star formation and feedback • need to efficiently expel gas from all halos, including very massive ones -- energy needed is more than SNae can provide
green lines= observations from SDSS & 2MASS SAM can be tuned to match local luminosity functions g r u number per unit volume z K i magnitude
GOODS: Near-IR selected galaxies KAB<22 PLE data SAM rss et al. ApJL 2004 GOODS special edition
SAMs underpredict EROs 13.5 5.8 3.2 1.0 0.5 0.1 KAB<22 GOODS rss et al. 2004 GOODS ApJL
Isolating the problem • comparing in the ‘observational’ plane is good, but many things can go wrong -- colors and luminosities are sensitive to: • details of star formation history (especially recent star formation) • stellar population models • metallicity • dust • we would like to first isolate the basic baryonic physics of star formation and feedback…
stellar mass assembly history new observational estimates from COMBO-17 and GOODS rss et al. 2004
stellar mass assembly history good agreement with estimates from Glazebrook et al. (GDDS) Rudnick et al. (FIRES) Dickinson et al. (HDFN) Fontana et al. (K20) rss et al. 2004
not all models do so well… Glazebrook et al. 2004
SAMs vs. N-body+hydro • most hydro simulations overpredict r* today because feedback is relatively ineffective • when strong outflows included `by hand’, results agree well with SAMs overall (e.g. Springel & Hernquist) semi-analytic models N-body+hydro Springel & Hernquist Nagamine et al.
sub-mm galaxies • models do not produce enough SMGs • are SMGs the progenitors of massive red galaxies at z=1? • possible solutions • top heavy IMF in bursts? • very cold dust? • Compton-thick AGN?
the optical/IR paradox • models do well at reproducing optically identified star forming populations at z~3-6 (LBGs) & global SFR • integral under green curve would exceed local stellar mass estimates if IMF is normal SFR implied by SMG’s SPH SAM
Constraints from the color-magnitude relation the tight relationship between color and luminosity for red sequence galaxies places strong constraints on their formation epoch Blakeslee et al. 2003 (ACS GTO team) RDCS1252 z=1.24
the color-magnitude distribution of field galaxies many fundamental galaxy properties seem to have bimodal distributions color SDSS luminosity Baldry et al. 2003
age = 8.4Gyr rest U-V color age = 5.5 Gyr red dots: early type blue dots: late type rest V magnitude (luminosity)
Critical mass old spheroidal quiescent ~2x10¹⁰ Mo ~stellar age AGN live in massive, blue galaxies! young disk type star forming log stellar mass Kauffmann et al. 2003, 2004
The origin of the red sequence • hierarchical models have traditionally had difficulty producing a red sequence with the right slope • this turns out to be a metallicity effect - if one fits the mass-metallicity relation, then CM slope comes out right (e.g., De Lucia et al. 2004) • in the following, I impose a Vc-Z* relationship to decouple chemical evolution from the problem
color-magnitude distribution not enough red & not red enough SDSS SAM g-r color r-band magnitude
color distributions -21.5 -20.5 -22.5 black: SDSS purple: SAM -18.5 -19.5
the problem is even worse at high redshift… red: n>2 blue: n<2 red: B/T>0.5 blue: B/T<0.5
Why are red galaxies red? • models produce enough old, massive galaxies. the problem is a continuous ‘trickle’ of star formation • there must be some process that shuts off star formation after galaxies have become massive • this process must be rapid, and seems to be connected with the presence of a spheroid
toy models • remove all remaining gas after major mergers • shut off cooling/SF when Mh>Mcrit • shut off star formation when Vc>Vcrit • shut off star formation when M*>Mcrit • shut off star formation when M*,bulge>Mcrit
toy models • remove all remaining gas after major mergers • has almost no effect (fresh gas gets accreted) • shut off cooling/SF when Mh>Mcrit • kills massive galaxies entirely; does not produce bimodality • shut off star formation when Vc>Vcrit • kills massive galaxies entirely; does not produce bimodality • shut off star formation when M*>Mcrit • kills massive galaxies entirely; does not produce bimodality • shut off star formation when M*,bulge>Mcrit
Color-magnitude distribution SAM: SF shut off when Mbulge>Mcrit SDSS
color distributions -22.5 -21.5 -20.5 black: SDSS purple: SAM -18.5 -19.5 SF shut off when Mbulge>Mcrit
When do galaxies arrive on the red sequence? black: GOODS ISAAC purple: new SAM 0.95<z<1.05 slope & zero-point of red sequence matches data at z~1 and gap appears in the right place!
Summary • standard LCDM models produce enough massive DM halos to host all massive galaxy candidates discovered so far • estimates of intrinsic properties like stellar mass and star formation rate allow us to directly test the recipes for star formation and feedback in galaxy formation models • hierarchical models do not naturally produce red galaxies because of continuous low level star formation. need a new process that quenches star formation in massive, bulge-dominated galaxies • a toy model based on the notion of AGN feedback reproduces fairly well the observed color-magnitude distribution (including bimodality) at z=0 and z=1
SAMs vs. N-body+hydro • same framework - cooling/merging w/in DM halos • SA treatment of cooling agrees well with results from SPH • same philosophy behind treatment of star formation, but SAMs lack detailed spatial/structural information • ESN prop to SFR -- but typically FB in simulations tends to be less effective than direct observations indicate (e.g., reheating rate ~ few x SFR) • sims typically contain less detailed modeling of chemical evolution, stellar populations, and dust • sims have limited volume and mass resolution, and more difficult to explore parameter space
EPS vs. N-body merger trees • merger trees based on the extended Press-Schechter model generally agree w/ N-body (rss et al. 2000) • formation times slightly biased late (Wechsler et al. 2002) log expansion factor of formation
SAM vs. SPH: masses of individual objects SAM SPH Helly et al. 2002
SAM vs. SPH: spatial locations Yoshida et al. 2002