Download
1 / 16
160 likes | 168 Vues
Transparency 8. Click the mouse button or press the Space Bar to display the answers. Splash Screen. Example 8-2b. Objective. Recognize when statistics and graphs are misleading. Example 8-2b. Vocabulary. None. Lesson 8 Contents. Example 1 Misleading Graphs

E N D
Transparency 8 Click the mouse button or press the Space Bar to display the answers.
Example 8-2b Objective Recognize when statistics and graphs are misleading
Example 8-2b Vocabulary None
Lesson 8 Contents Example 1Misleading Graphs Example 2Misleading Statistics
Example 8-1a BUSINESSThe line graphs below show the last 10 weeks of sales for the Crumby Cookie Bakery. Which graph would be better to help convince a bank loan officer to open a $20,000 loan to remodel a kitchen? Why might this graph be considered misleading? Compare the slopes of the lines 1/2
Example 8-1a BUSINESSThe line graphs below show the last 10 weeks of sales for the Crumby Cookie Bakery. Which graph would be better to help convince a bank loan officer to open a $20,000 loan to remodel a kitchen? Why might this graph be considered misleading? The slope is less steep in Graph A showing a slower decline in profits 1/2
Example 8-1a BUSINESSThe line graphs below show the last 10 weeks of sales for the Crumby Cookie Bakery. Which graph would be better to help convince a bank loan officer to open a $20,000 loan to remodel a kitchen? Why might this graph be considered misleading? The intervals on Graph A is larger which will indicate less of a slope 1/2
Example 8-1a Answer:Graph A would be better because it shows less of a decline in sales. It might be considered misleading because it does not show the consistent decline in sales because the intervals are larger 1/2
Example 8-1b ProfitThe line graph below shows the monthly profits of a company from May to October. Explain why the graph is misleading. Answer: The graph is misleading because the vertical scale has differing intervals. The increases in profits are exaggerated. 1/2
Example 8-2a GRADESMichael and Melissa both claim to be earning a C average, 70% to 79%, in their Latin class. Use the table below to explain their reasoning and determine which student is earning a C average. Find the mean and median of both Michael and Melissa’s scores Mean = 80 + 76 + 73 + 70 + 40 + 25 + 10 7 Mean = 374 7 Michael’s Mean = 53.43% 2/2
Example 8-2a GRADESMichael and Melissa both claim to be earning a C average, 70% to 79%, in their Latin class. Use the table below to explain their reasoning and determine which student is earning a C average. Find the mean and median of both Michael and Melissa’s scores Mean = 88 + 83 + 75 + 70 + 60 + 65 + 62 7 Mean = 503 7 Melissa’s Mean = 71.86% 2/2
Example 8-2a GRADESMichael and Melissa both claim to be earning a C average, 70% to 79%, in their Latin class. Use the table below to explain their reasoning and determine which student is earning a C average. Median is middle number and the test scores are already ordered from least to greatest Since there are 7 pieces of data and half of 7 is 3.5, count down 3 scores then up 3 scores Both Medians = 70% 2/2
Example 8-2a GRADESMichael and Melissa both claim to be earning a C average, 70% to 79%, in their Latin class. Use the table below to explain their reasoning and determine which student is earning a C average. MichaelMelissa mean 53.4% 71.9% median 70% 70% Answer: Michael is using the median to describe his grade rather than the mean. Only Melissa’s mean or average is 70% or better. 2/2
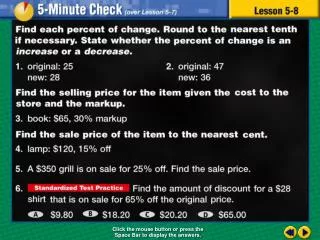
Example 8-2b RETAIL SALESTwo different grocery stores each claim to have the lowest average prices. Use the table below to explain their reasoning and determine which store really has the lowest average prices. Answer: Store A: Mean = $3.19 Median = $2.14 Store B: Mean = $2.79 Median = $2.42 Store B has the lowest price 2/2
End of Lesson 8 Assignment