Download
1 / 1
20 likes | 103 Vues
LIBS for Precision Laboratory Astrophysics Measurements. (d). (e). intensity ( a.u .). intensity ( a.u .). 300. 400. 500. 600. 700. 780. 200. wavelength (nm). 300. 400. 500. 600. 700. wavelength (nm). 6p 6 K 9/2. 23229.99(cm -1 ). 636nm. 495nm. 5d 6 I 7/2. 7524.74(cm -1 ).

E N D
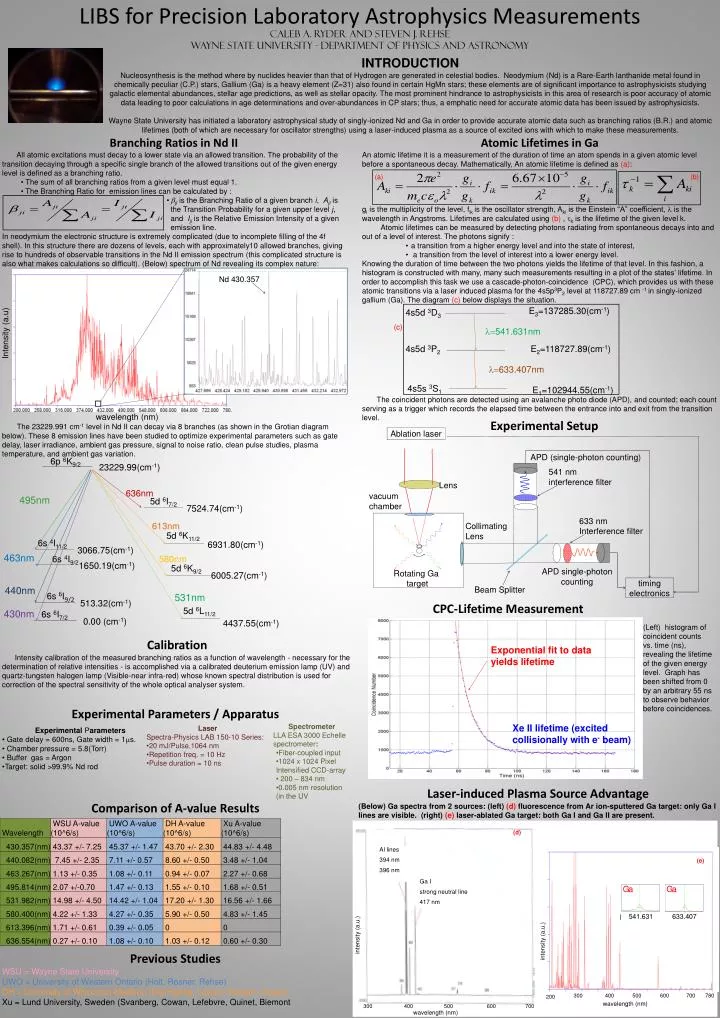
LIBS for Precision Laboratory Astrophysics Measurements (d) (e) intensity (a.u.) intensity (a.u.) 300 400 500 600 700 780 200 wavelength (nm) 300 400 500 600 700 wavelength (nm) 6p 6K9/2 23229.99(cm-1) 636nm 495nm 5d 6I7/2 7524.74(cm-1) 613nm 5d 6K11/2 6931.80(cm-1) 463nm 580nm 5d 6K9/2 440nm 531nm 5d 6L11/2 430nm 4437.55(cm-1) Al lines 394 nm 396 nm Ga I strong neutral line 417 nm Caleb A. Ryder and Steven J. Rehse Wayne State University - Department of Physics and Astronomy • Branching Ratios in Nd II • All atomic excitations must decay to a lower state via an allowed transition. The probability of the transition decaying through a specific single branch of the allowed transitions out of the given energy level is defined as a branching ratio. • The sum of all branching ratios from a given level must equal 1. • The Branching Ratio for emission lines can be calculated by : • bji is the Branching Ratio of a given branch i, Ajiis the Transition Probability for a given upper level j, and Iji is the Relative Emission Intensity of a given emission line. • In neodymium the electronic structure is extremely complicated (due to incomplete filling of the 4f shell). In this structure there are dozens of levels, each with approximately10 allowed branches, giving rise to hundreds of observable transitions in the Nd II emission spectrum (this complicated structure is also what makes calculations so difficult). (Below) spectrum of Nd revealing its complex nature: • The 23229.991 cm-1 level in Nd II can decay via 8 branches (as shown in the Grotian diagram below). These 8 emission lines have been studied to optimize experimental parameters such as gate delay, laser irradiance, ambient gas pressure, signal to noise ratio, clean pulse studies, plasma temperature, and ambient gas variation. • Atomic Lifetimes in Ga • An atomic lifetime it is a measurement of the duration of time an atom spends in a given atomic level before a spontaneous decay. Mathematically, An atomic lifetime is defined as (a): • gi is the multiplicity of the level, fik is the oscillator strength, Aki is the Einstein “A” coefficient, l is the wavelength in Angstroms. Lifetimes are calculated using (b) , tk is the lifetime of the given level k. • Atomic lifetimes can be measured by detecting photons radiating from spontaneous decays into and out of a level of interest. The photons signify : • a transition from a higher energy level and into the state of interest, • a transition from the level of interest into a lower energy level. • Knowing the duration of time between the two photons yields the lifetime of that level. In this fashion, a histogram is constructed with many, many such measurements resulting in a plot of the states’ lifetime. In order to accomplish this task we use a cascade-photon-coincidence (CPC), which provides us with these atomic transitions via a laser induced plasma for the 4s5p3P2 level at 118727.89 cm -1in singly-ionized gallium (Ga). The diagram (c) below displays the situation. • (c) • The coincident photons are detected using an avalanche photo diode (APD), and counted; each count serving as a trigger which records the elapsed time between the entrance into and exit from the transition level. (a) (b) Nd 430.357 INTRODUCTIONNucleosynthesis is the method where by nuclides heavier than that of Hydrogen are generated in celestial bodies. Neodymium (Nd) is a Rare-Earth lanthanide metal found in chemically peculiar (C.P.) stars, Gallium (Ga) is a heavy element (Z=31) also found in certain HgMn stars; these elements are of significant importance to astrophysicists studying galactic elemental abundances, stellar age predictions, as well as stellar opacity. The most prominent hindrance to astrophysicists in this area of research is poor accuracy of atomic data leading to poor calculations in age determinations and over-abundances in CP stars; thus, a emphatic need for accurate atomic data has been issued by astrophysicists.Wayne State University has initiated a laboratory astrophysical study of singly-ionized Nd and Ga in order to provide accurate atomic data such as branching ratios (B.R.) and atomic lifetimes (both of which are necessary for oscillator strengths) using a laser-induced plasma as a source of excited ions with which to make these measurements. Intensity (a.u) E3=137285.30(cm-1) 4s5d 3D3 Experimental Setup l=541.631nm 4s5d 3P2 E2=118727.89(cm-1) wavelength (nm) l=633.407nm 4s5s 3S1 E1=102944.55(cm-1) Ablation laser APD (single-photon counting) 541 nm interference filter Lens 6005.27(cm-1) 6s6I9/2 vacuum chamber 6s 4I9/2 6s 6I7/2 513.32(cm-1) 1650.19(cm-1) 633 nm Interference filter 0.00 (cm-1) 6s 4I11/2 CPC-Lifetime Measurement APD single-photon counting Rotating Ga target timing electronics 3066.75(cm-1) Collimating Lens (Left) histogram of coincident counts vs. time (ns), revealing the lifetime of the given energy level. Graph has been shifted from 0 by an arbitrary 55 ns to observe behavior before coincidences. Calibration Intensity calibration of the measured branching ratios as a function of wavelength - necessary for the determination of relative intensities - is accomplished via a calibrated deuterium emission lamp (UV) and quartz-tungsten halogen lamp (Visible-near infra-red) whose known spectral distribution is used for correction of the spectral sensitivity of the whole optical analyser system. Exponential fit to data yields lifetime Beam Splitter Experimental Parameters / Apparatus • Spectrometer • LLA ESA 3000 Echelle spectrometer: • Fiber-coupled input • 1024 x 1024 Pixel Intensified CCD-array • 200 – 834 nm • 0.005 nm resolution (in the UV Xe II lifetime (excited collisionally with e- beam) • Laser • Spectra-Physics LAB 150-10 Series: • 20 mJ/Pulse,1064 nm • Repetition freq. = 10 Hz • Pulse duration = 10 ns • Experimental Parameters • Gate delay = 600ns, Gate width = 1s. • Chamber pressure = 5.8(Torr) • Buffer gas = Argon • Target: solid >99.9% Nd rod Laser-induced Plasma Source Advantage (Below) Ga spectra from 2 sources: (left) (d) fluorescence from Ar ion-sputtered Ga target: only Ga I lines are visible. (right) (e) laser-ablated Ga target: both Ga I and Ga II are present. Comparison of A-value Results Previous Studies WSU = Wayne State University UWO = University of Western Ontario (Holt, Rosner, Rehse) DH = University of Wisconsin-Madison (DenHartog, Lawler, Sneden, Cowan) Xu = Lund University, Sweden (Svanberg, Cowan, Lefebvre, Quinet, Biemont