Download
1 / 16
160 likes | 298 Vues
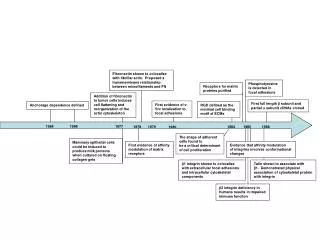
Taesombut and Yevjevich , 1978. * Note that all of the methods are trying to place rank relative to the total number of observations, but that the exact method, and the “estimates” that they provide, vary.

E N D
* Note that all of the methods are trying to place rank relative to the total number of observations, but that the exact method, and the “estimates” that they provide, vary.
The experiment is repeated using 30 samples generated from a normal distribution (Mean = 600; Standard Deviation = 50). The various plotting formulae are applied to each of 20 realizations (“runs of 30 years”) and compared to the known population
SOME CONCLUSIONS We still have no definitive answer 100 years after Hazen first published his work! Beware of taking Plotting Position as being the ABSOLUTE TRUTH – it is only an approximation!