Download
1 / 53
530 likes | 539 Vues
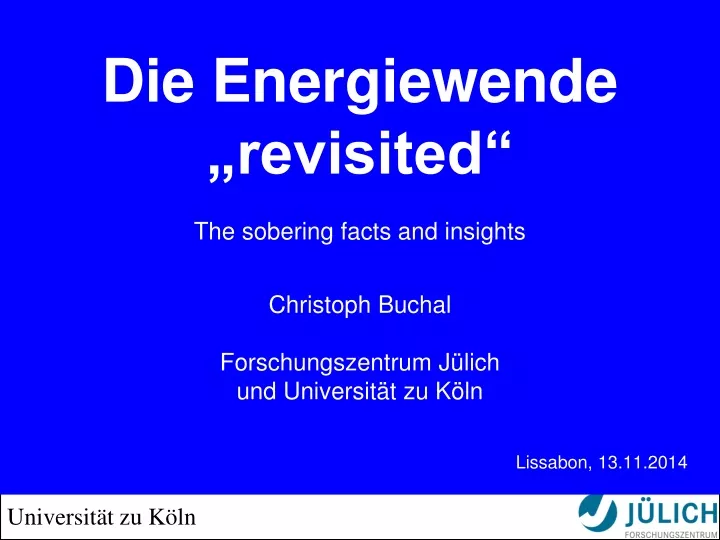
Die Energiewende „revisited“ The sobering facts and insights. Christoph Buchal Forschungszentrum Jülich und Universität zu Köln Lissabon, 13.11.2014. Renewables of Primary Energy: 11,5% (Germany 2013). „Burning wood“. Wind: 1,4% PV: 0,8% used for electricity.

E N D
Die Energiewende „revisited“The sobering facts and insights Christoph BuchalForschungszentrum Jülichund Universität zu Köln Lissabon, 13.11.2014
Renewables of Primary Energy: 11,5% (Germany 2013) „Burning wood“ Wind: 1,4% PV: 0,8% used for electricity • Nobody counts cleverly designed houses …
2013: 23,9% 8,4 % 7,5 % 4,7 % 3,2 % Gesamtprod. 2013: 634 TWh ~ „77 GW“
A nonlinear transfomation (Many sources, cb) < 25% „EE-Strom“: fairly easy get flexibel, use grid for import/export , EEX neighbours 40% EE-Strom (2020) : possible (? even closing all KKW) New political goal: total CO2 emissions -40% in 2020 cf. 1990 80% EE-Strom (2050) : difficult, very expensive(no KKW) 100% EE-Strom (date ?) (without KKW) This last 20% step is as expensive as the 80% before (cb: more probable are many simple, open gas turbines)
GERMANY: Primary Energy time line Nuclear Gas Coal Oil
GERMANY: End – Energy time line electricity heat car fuel • Note, that electricity and fuel stays nearly unchanged
All this is a real struggle… • Extra commitment for PV only: > 100 Mia Euro (10↑11) • Wind + PV- current costs more than 25 Mia Euro (2013) • representing a market value of less 2,5 Mia Euro • but „Energiewende“ is mostly for electrical power • no solutions for car fuel (well, we have Russian gas) • Politicians have changed technical issues to emotions…
All this is a real struggle… • The EMOTIONAL campaigns • everybody claims to save the planet • „green current“ is a priori good (many commercials) • small individual power plants are better ( not true) • green flying, mailing, driving is in (many commercials) • even power companies sing the RE song (many commercials) • everybody badly wants to earn money with RE • BUT everybody cries: NIMBY ! to power lines and turbines
Global: approx. 1.1 t / head year = 8 Mia t (China: 3.8 Mia t) Coal is cheap: ca. 1 cent/kWh Plus oil: approx. 0.62 t / head year
1. Juni 2014: 401,82 ppm Slope unchanged only 2 ppm / year Thankstotheoceans ! (Tragedy: Ridinganother tiger) D: 2,5% → global attractive ? or rich man´s sports ?
Wohlstand und Primär-Energiebedarf (2009-2010) 2014: China 3,3 kW( +10% pro Jahr) D gesamt: 450 GW (Primär-E.) China: 4240 GW mit +10% pro Jahr ▲▲ ▲▲ Über 4 Milliarden Menschen leben „hier“! Wohlstand und Energiebedarf sind generell sehr schwer zu trennen (Prioritäten: Essen, Wohnen, Jobs, Gesundheit, Zukunft für die Kinder, … Umwelt)
All this is a real struggle… The TIME mismatch HUGE intermittend and unreliable RE production No storage Second line of conventional power plants needed (suffering) Give away of overproduction to neighbors (complaining) Growing cut-off of excess RE current (even more expensive)
UBA – Szenario 2050 New: Lots of energy, not needed… What is the value of this … zero? Gradienten heute: 1 GW in 15 min (GKW, BOA: 30 MW/min) 2050: > 13 GW in 15 min (nicht beherrscht)
Verzicht auf die konzentrierten Fossilen Energieträger Turm mit 5 MWmax: ca. 9 Mio kWh/y kostet ca. 10 Mio. Euro 21,4% …………..… 18% We observe economic cannibalism – new installations hurt all the others…
All this is a real struggle… The SPACE mismatch Large RE power production in North Germany Certain closing of Nuclear Plants in South Germany New HV trunk lines are needed - big NIMBY ! Send overproduction to neighbors (complaining) Growing cut-off of excess RE current (even more expensive) Dream of the European Copper Plate
Timescale for each new power line: Planning: 1 y Legal struggle: 8 y Installation: 1 y
NorNed-Kabel (Statnett - TenneT) Länge: 580 km, Technologie: +/- 450 kV DC-Kabel Übertragungsleistung: 0,7 GW Kosten: 600 Mio. Euro Just connect Norway with some new Cables of 200x Capacity Serious proposal of German environmentalist advisers SRU, Sachverständigenrat für Umweltfragen: 100% RE power until 2050
All this is a real struggle… The E - MARKET dilemma Guaranteed acceptance of all RE power (independent of demand) Rolling out known technology – very little R&D incentive Dream of the European Copper Plate (enables European market) Send overproduction to neighbours (complaining) Buy underproduction from neighbours Store overproduction at neighbours Cut-off of excess RE current (expensive) The painful market distortion: a sick (non-) merit order
Europäische Strombörse EEX : One price for all First all RE are accepted at ZERO incremental cost („Fuel cost“) The remaining energy is produced by the conventional plants
All this is a real struggle… The E - MARKET dilemma Energy is priced, price is frequently very low Customer pay independent of demand/supply situation All plants are trying to compensate for RE fluctuations Brown coal is running Gas plants are shut down completely NO FAIR MARKET MODEL KNOWN
All this is a real struggle… The Customers´ dilemma Cost of production has been rising Future cost of transport rising (The joy of a „natural monopoly“) Smart metering ? Many rich guys get much richer ! Owners of PV-cells need to market their energy in the future ? Electro – Car ? Battery unit in the basement ?
Sundry Taxes Transportation RE - Umlage Everyone pays the Umlage, but it represents only < 20% of energy produced Production cost a la „Merit Order“
All this is a real struggle… The MAIN MISTAKES Unlimited wind- and PV- installation volume Unlimited priority feeding into the grid – killing the market concept Supporting essentially only known technology A powerful RE industrial lobby has been established Political fear of accepting mistakes and exaggerations Better: Back to the R&D – labs ! Back to pragmatism – less political hot air !
A nonlinear transfomation (Many sources, cb) < 25% „EE-Strom“: very easy get flexibel, use grid for import/export , EEX neighbours 40% EE-Strom (2020) : possible (closing all KKW) coal + gas + storage + improved grid + EEX need neighbours + frequent cuts of EE-peaks 80% EE-Strom (2050) : difficult, very expensive (no KKW) + improve storage by >100% + massive power to gas + EEX badly need neighbours + expect up to 70 GW deficits 100% EE-Strom (date ?) (without KKW) This last 20% step is as expensive as the 80% before (cb: more probable are many simple, open gas turbines)
Die Strom –Wende muss auf 4 Säulen ruhen: 1 – Flukt. Produktion 2 – Transport 3 – Speicher 4 – Flexible Nutzer Zu schnell gewachsen Zu langsam gefolgt Derzeit keine Chance Offen, Zukunftsmusik 3 - Speicher - Beispiel E-Auto: Akku 15 kWh, Kosten ca. 5000 €, 2000 Zyklen „Strom-Wert“: 1 - 4 €, Abschreibung: 2,5 €/Zyklus … teuer 4 – Beispiele: E- Autos ! „Smart Country“ (?) Wasserstoff –Technik Brennstoffzellen (!) Chem. Industrie (möglichst nicht den teuren Wasserstoff als Brenngas entwerten)
Stromversorgung in Deutschland (2014) 82 Mio x 0.9 kW = 74 GW (im Mittel) Schwachlast unter 40 Spitzenlast über 80 PV max (2014)36 Wind max 34 Summe PV + Wind (max.): 70 (!) PV im Mittel nur ca. 10% der max. Leistung Wind: ca. 20% KKW (10) 13 KKW(17): 20,3 Fossil (>120) 60 Wasser (incl. Speicher)10,4 Speicher 40 GWh @ 8,2 GW
-20_neg_Börse_Leipzig03.jpg -20_neg_Börse_Leipzig03.jpg -20_neg_Börse_Leipzig03.jpg -20_neg_Börse_Leipzig03.jpg
Große WEA sind erstaunlich ! 12 Türme 45 km vor Borkum 5 MW Generatoren H: 143 m (Kölner Dom: 157 m) D: 116 m (Rotordurchmesser) T: bis 60 m unter Meeresspiegel „Volllaststunden“: ca. 40% von 8760 h an Land: 18-20% Deutschland 2013: ca. 24 000 Anlagen mit ges. 33,6 GW (peak) Für die Energieausbeute gilt:1000 große 5MW-WEA offshore ~ „Biblis A + B“ oder 2000 onshore
London array: 175 WEA mit 630 MW(peak) • Endausbau: 340 WEA , mehr als 1 GW(peak) (Energie: 1/5 Weisweiler)
Gebiete für geplante Windparks ( > 45 GWpeak) • etwa 300 km vom Festland bis zum weitesten Park
Verbrauchsbedingter Lastfluss durch schwankende Erzeugung überlagert Energiewende Mo Di Mi Do Fr Sa So Mo Di Mi Do Fr Sa So Strombezug Strombezug Stromrückspeisung Fluktuierende Lastflüsse in den Verteilungsnetzen(derzeit noch nicht kontrolliert oder steuerbar)
Bodenreibung Wald Hindernisse A B S T A N D ! Jeder zusätzliche Meter an Höhe bringt ein Prozent an Ertrag mehr !!!
Welt – Energiebedarf 2011 Umsatz (als mittl. Leistung) !!! Sonneneinstrahlung 170 000 TW Die Nutzung der Sonnenwärme (durch Architektur) bleibt hier völlig verborgen !
Ein Mini – Quiz Ölpreis 1970: ??? $ / barrel (1 Faß = 159 Liter) Ölpreis heute: ???
Öl ist der Motor der Weltwirtschaft … wie lange noch? Sommer 2008: $140 → $40 6/2014: $ 113 (Brent) 1970: $ 1.20 „Danke“ für das wundervoll billige Öl ( Energie ist entscheidend – „Lebensmittel“- „Blut“ – „Droge“ … Viel wertvoller als Geld - Die EZB kann leider keinerlei Energieträger drucken)
Die Welt steckt noch mittendrin … 1. Industrielle Revolution: Kohle, Stahl, Dampfkraft,… 2. I.R.: Öl, Motoren, Autos, Flugzeuge Strom, Netze, 1000 Elektrogeräte 3. I.R.: Telefon, Radio, TV, Computer, Automatisierung Internet, Smartphones … Verschmelzung Grüne Revolution: Ernten x 3, „Brot aus Luft“ Heute: 20 000 m² Land pro Kopf weltweit 30% Wü - 30% Wa – 20% Wei - 10% Bau 2 000 m² Ackerfläche pro Kopf weltweit Wir stehen jetzt am Beginn der 4. I. R.