Download
1 / 38
380 likes | 505 Vues
Tabulating Survey Results in Excel using EZAnalyze. Paul Pope Extension Program Specialist – Evaluation Leader – Evaluation & Accountability Collaborative Extension Education 979-845-7202 ppope@tamu.edu. Overview of EZAnalyze. EZAnalyze is an “add-in” for Excel.

E N D
Tabulating Survey Results in Excel using EZAnalyze Paul Pope Extension Program Specialist – Evaluation Leader – Evaluation & Accountability Collaborative Extension Education 979-845-7202ppope@tamu.edu
Overview of EZAnalyze • EZAnalyze is an “add-in” for Excel. • That means, once installed, it shows up under the Add-Ins tab on the top menu bar. • EZAnalyze assumes data are entered into Excel in exactly the way Extension Education has trained faculty to do so! • All operations are incorporated into the pull-downs – no cell ranges to define; no formulas or functions to create!
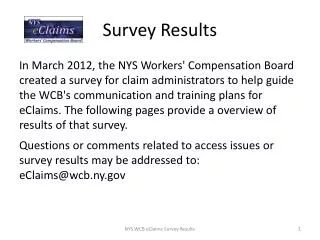
Case Scenario • The AG/NR Agent in Lone Star County conducted a one-day workshop on subsurface drip irrigation (SDI) • Used a short survey for the evaluation • Customer satisfaction • Plans to adopt • Level of understanding before vs. after (retrospective post) • A few “open-ended” questions (comments) • 20 participants completed the survey • Want to measure customer satisfaction and impact of the workshop on level of understanding (hopefully it increased in areas covered).
Coding the Data • Assign (write) a numeric code to each survey form. • In this scenario, use 1 – 20. 1 Survey ID
Preparing to Enter the Data • Create a variable name for each question on the survey • Can use spaces in the variable names • Descriptive variables names 1 Survey ID Over sat Quality Accuracy New Easy Range Complete Timely Helpful Know
Preparing to Enter the Data 1 Survey ID q1 q2a q2b q2c q2d q2e q2f q2g q2h q2i
Working with the Spreadsheet • Start with a blank spreadsheet. • Place your variable names across the first row. This is what EZAnalyze uses for its list of variables in the pull-down menus.
Working with the Spreadsheet • Can add background color using “fill color” to facilitate data entry
Coding the Data 1 5 1 2 3 4 5 1 2 3 4 5 4 3 2 4 5 5 4 4 4
1 5 4 3 2 4 5 5 4 4 4
Entering Data • Continue entering surveys until all 20 are in the spreadsheet. • You now have 20 rows of data (1 row per survey) • Each column is a variable – this is what you’ll analyze (For missing values, leave the cell blank)
Using EZAnalyze • All pull-down menus (no cell ranges or Excel functions). • Make sure you’re in the Excel sheet with the data when using the menus. • Click on the desired analysis. • Click on the variables you want analyzed. • EZAnalyze will place the results in a new Excel sheet.
Options within EZAnalyze • Describe – for percentage and descriptive statistics such as mean, median, max, min, etc. • Disaggregate – break down results by categories • Graph – create basic graphs • Advance – run advanced statistical tests such as correlation, t-test, ANOVA • Delete Xtra Sheets – Deletes sheets (results) produced by EZAnalyze
DESCRIBE • Describe – for percentage and descriptive statistics such as mean, median, max, min, etc. • Select which option you want.
DESCRIPTIVE STATISTICS • Click on the variables you want to describe (on the left) • Click on the stats you want (on the right)
DESCRIPTIVE STATISTICS • Results are placed in a new Excel sheet (EZA1) • Statistics you selected are displayed for the variables you selected
DESCRIPTIVE STATISTICS • Compare means on level of understanding (before vs. after) • Entering before and after side-by-side makes the comparison easy to see.
PERCENTAGES • Note: be sure to return to the sheet with your raw data.
PERCENTAGES • Results are placed in a new Excel sheet (EZA2) • Percentages are displayed for each variable you selected • Includes frequency, percent, valid percent, and cumulative percent • Percent vs. Valid Percent (use Valid Percent)
What Do We Want to Demonstrate? • Participants were mostly or completely satisfied with the activity overall (Q1). - percent at top level (“completely” (5)) - percent at top two levels combined (“completely” (5) or “mostly” (4)) • Participants were mostly or completely satisfied with individual elements of the activity (Q2a-j). - percent at top level (“completely” (5)) - percent at top two levels combined (“completely” (5) or “mostly” (4)) • Which elements of the activity were participants most satisfied with. (Q2a-j) - comparison of means • Level of understanding increased – using a comparison of before vs. after (Q4a-s) - percent at top level (“excellent” (4)) - percent at top two levels combined (“excellent” (4) or “good” (3)) - comparison of means - percent who increased understanding (using a difference variable) • Participants plan to adopt SDI technology (Q3) - percent “definitely” (1)or “probably”(2) • Most participants would recommend another Extension activity on this topic (Q5). - percent “yes” (1)
PERCENT • Participants were mostly or completely satisfied with the activity overall (Q1). - percent at top level (“completely” (5)) - percent at top two levels combined (“completely” (5) or “mostly” (4)) • Participants were mostly or completely satisfied with individual elements of the activity (Q2a-j). - percent at top level (“completely” (5)) - percent at top two levels combined (“completely” (5) or “mostly” (4)) • Which elements of the activity were participants most satisfied with. (Q2a-j) - comparison of means • Level of understanding increased – using a comparison of before vs. after (Q4a-s) - percent at top level (“excellent” (4)) - percent at top two levels combined (“excellent” (4) or “good” (3)) - comparison of means - percent who increased understanding (using a difference variable) • Participants plan to adopt SDI technology (Q3) - percent “definitely” (1) or “probably” (2) • Most participants would recommend another Extension activity on this topic (Q5). - percent “yes” (1)
PERCENT 1. 3. 2.
PERCENT • Question 1 • 53% were completely satisfied with the workshop, overall. • 79% were completely or mostly satisfied with the workshop, overall. • (52.6+26.3) • Question 2a • 35% were completely satisfied with the quality of course materials. • 90% were completely or mostly satisfied with the quality of course materials. (35.0 + 55.0)
PERCENT • Question 3 • 41% indicated that they will definitely adopt SDI. • 94% indicated that they will definitely or probably adopt SDI. (can use cumulative percent) • Question 4 • 20% indicated an “excellent” level of understanding of basic SDI components before the workshop; increasing to 50% after the workshop. • 35% indicated an “excellent” or “good” level of understanding of basic SDI components before the workshop; increasing to 100% after the workshop.
PERCENT • Question 5 • 95% would attend another activity on this topic offered by Extension.
MEAN • Participants were mostly or completely satisfied with the activity overall (Q1). - percent at top level (“completely” (5)) - percent at top two levels combined (“completely” (5) or “mostly” (4)) • Participants were mostly or completely satisfied with individual elements of the activity (Q2a-j). - percent at top level (“completely” (5)) - percent at top two levels combined (“completely” (5) or “mostly” (4)) • Which elements of the activity were participants most satisfied with. (Q2a-j) - comparison of means • Level of understanding increased – using a comparison of before vs. after (Q4a-s) - percent at top level (“excellent” (4)) - percent at top two levels combined (“excellent” (4) or “good” (3)) - comparison of means - percentwho increased understanding (using a difference variable) • Participants plan to adopt SDI technology (Q3) - percent “definitely” (1) or “probably” (2) • Most participants would recommend another Extension activity on this topic (Q5). - percent “yes” (1)
MEANS 1. 3. 2.
MEANS • Question 2 • (most satisfying elements of the workshop) • Information being accurate • Range of topics covered • Completeness of information given on each topic • Knowledge level of presenters on the subject • (least satisfying elements of the workshop) • Information being new to you Question 4On a 4-point scale from 1 (Poor) to 4 (Excellent), level of understanding on basic components of SDI increased from 2.35 to 3.50.
PERCENT WITH INCREASED UNDERSTANDING • Participants were mostly or completely satisfied with the activity overall (Q1). - percent at top level (“completely” (5)) - percent at top two levels combined (“completely” (5) or “mostly” (4)) • Participants were mostly or completely satisfied with individual elements of the activity (Q2a-j). - percent at top level (“completely” (5)) - percent at top two levels combined (“completely” (5) or “mostly” (4)) • Which elements of the activity were participants most satisfied with. (Q2a-j) - comparison of means • Level of understanding increased – using a comparison of before vs. after (Q4a-s) - percent at top level (“excellent” (4)) - percent at top two levels combined (“excellent” (4) or “good” (3)) - comparison of means - percentwho increased understanding (using a difference variable) • Participants plan to adopt SDI technology (Q3) - percent “definitely” (1) or “probably” (2) • Most participants would recommend another Extension activity on this topic (Q5). - percent “yes” (1)
% Who Increased Using a Difference Variable • Want to create a difference variable for each before-after item on question 4, where difference = after – before. • Then run a frequency table on the difference variable. • The percentage for “0” represents “no change.” • The percentage for all positive numbers represents a positive change (moving up on the scale). • The percentage for all negative numbers represents a negative change (moving down on the scale). Hopefully there will be none or very few of these.
% Who Increased Using a Difference Variable 3. Delete any emptycolumns between the last variable and the new difference variable (q4a_chg).
% Who Increased Using a Difference Variable • As a direct result of the workshop, almost three-fourths of participants (72%) perceived that their level of understanding of basic SDI components increased. • 28% moved up 1 step on the scale; 33% moved up 2 steps on the scale; 11% moved up 3 steps on the scale. • Can repeat this process for q4b – q4s.
TAKING A STEP BACK • EZAnalyze is worth using just for the ease of producing means and percentages in Excel! • Use it for that if nothing else (most will). • It will do more (graphs, filtering, advance statistics).
Advanced Statistics • These are inferential statistical tests – meaning they assume the data represents a sample of the population (rather than a census). • Bottom line: there is no reason to run these tests unless you collected data from a random sample of your participants. These tests are not applicable to typical evaluations of county programs.
Obtaining EZAnalyze • Free for educators. • The program and manual must be obtained through the EZAnalyze web site. Do not distribute or accept a copy of either from someone else. • Go to www.ezanalyze.com • Click on the Download button to access the program file and manual. There is just a few questions to answer. • Follow the installation instructions.