Download
1 / 6
60 likes | 136 Vues
U.S. Exports by Region, 2004. OPEC 3%. Central and South America 7%. Canada 23%. Other 6%. Mexico 14%. Pacific Rim 26%. European Union 21%. Total = $819 billion. U.S. Imports by Region, 2004. OPEC 6%. Central and South America 7%. Other 6%. Canada 17%. Mexico 11%.

E N D
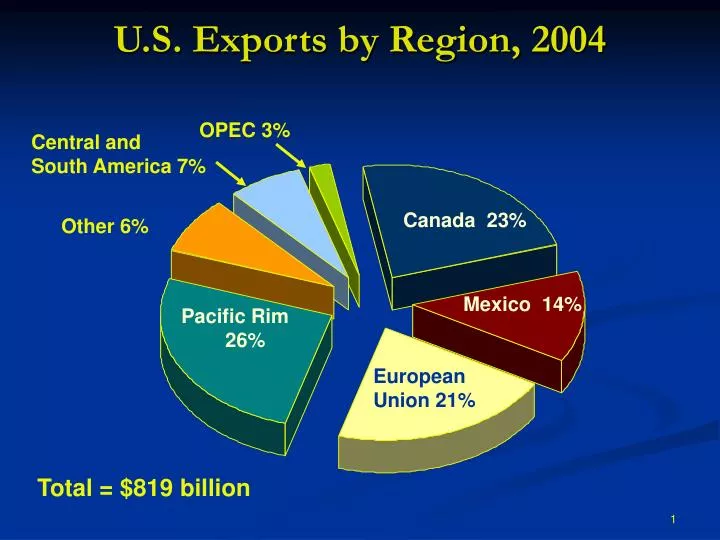
U.S. Exports by Region, 2004 OPEC 3% Central and South America 7% Canada 23% Other 6% Mexico 14% Pacific Rim 26% European Union 21% Total = $819 billion
U.S. Imports by Region, 2004 OPEC 6% Central and South America 7% Other 6% Canada 17% Mexico 11% Pacific Rim 33% European Union 19% Total = $1,470 billion
International Trade • Group of 8 – G8 • US • Japan • Germany • France • UK • Italy • Canada • Russia
Balance of Trade • Balance of trade – the difference between the value of exports and the value of imports. • Trade deficit – imports > exports • Trade surplus – exports > imports • The U.S. has a significant trade deficit of approximately 5% of GDP. • The U.S. is financing its trade deficit by selling off financial assets, stocks and bonds, and real assets, corporations and real estate.
U S Immigration, Number and Rate: 1900 to 2001, by Decade