Download

1 / 37
370 likes | 521 Vues
Effect of Single Nucleotide Polymorphism in Affymetrix probes. Olivia Sanchez-Graillet Departments of Biological Sciences and Mathematical Sciences University of Essex (UK) December 2008. Single Nucleotide Polymorphisms (SNPs ) .

E N D
Effect of Single Nucleotide Polymorphism in Affymetrix probes Olivia Sanchez-Graillet Departments of Biological Sciences and Mathematical Sciences University of Essex (UK) December 2008
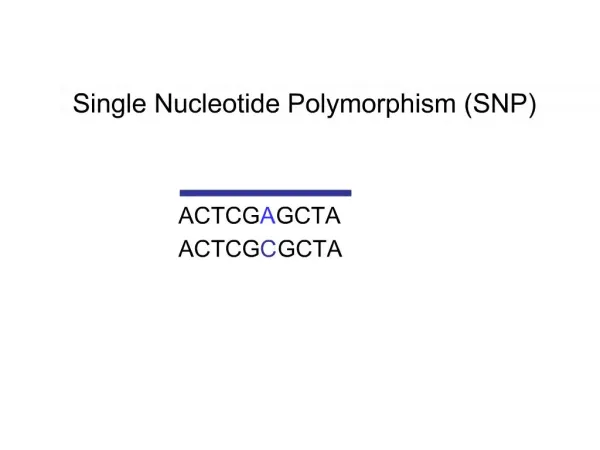
Single Nucleotide Polymorphisms (SNPs ) • SNPs: a single base pair is different between one individual and the other. • Polymorphism: if at least two variants have frequencies > 1% in a population.
SNPs are the most common type of sequence variation between individuals. • SNPs are markers of phenotypes and diseases. • SNPs may alter the gene expression and may change or not the amino acid sequence.
Other common variations: • DIP: deletion/insertion polymorphism : -/T , C/- • STR: short tandem repeat (microsatellite) polymorphism • (CA)19/20/21/22/23/24/25/26 • MIXED: cluster containing submissions from 2 or more alleleic classes • -/AAA/AAAAA/AAAACCAAAAAAAAAAAAAAA • MNP: multiple nucleotide polymorphism with alleles of common length > 1 • AAA/CCC
We are studying the relationships between probes intensities on Affymetrix GeneChips. Affymetrix Gene chips contain thousands of probes
Probes map to different exons. Because of alternative splicing, some of the exons may be upregulated whereas others may be downregulated. We therefore focus on probes within exons.
Probes mapping to the same exon should behave similarly. • What causes Affymetrix probes to behave as outliers with respect to other probes within a single exon? • Objective: • Study the impact of SNPs and other common variation upon Affymetrix probes on GeneChips. • Explore whether the existence of a SNP causes a probe to behave differently to other probes which map uniquely to a single exon.
Previous research on how SNPs might affect gene expression: • Allele A is over-expressed compared to allele B or vs or both alleles are equally expressed (Kumari et al.,2007). • Hybridization resulted from variation might mislead the interpretation of data from individual genes, even if a single probe is affected (Alberts et al., 2007). • In 15 of 25 probesets, SNPs caused a difference in hybridization. Not every SNP causes a difference in hybridization (Alberts et al., 2007). • When the SNPs located at the very beginning or end of a probe, it might have little or not effect on hybridization (Hughes et al., 2001).
Method: • Generation of exon heatmaps • Identification of probes containing SNPs. • Study of SNP-probes which are outliers.
(A) Generation of exon heatmaps • CEL files are downloaded from the GEO database. • Calibration of microarray data: • Quality control: detection of spatial flaws. • Row Quantile Normalisation. • Correlate the intensities for groups of probes, using many thousands of GeneChip experiments.
Example flaw in CEL file W. B. Langdon et al. (2008). A Survey of Spatial Defects in Homo Sapiens Affymetrix GeneChips. In IEEE/ACM Transactions on Computational Biology and Bioinformatics.
Probe correlations The correlation in log intensities between Probe 9 and Probe 11 from probeset 208772_at, obtained from 5,638 HG-U133A GeneChips.
Probe number on heatmap Average intensity in GEO Standard deviation in GEO The number in each square is the correlation multiplied by 10 and rounded Blue = low correlation Yellow = high correlation Relative probe position on exon
exon 1 transcript 1 probe 1 (25 bases, 100% identity) exon 2 exon 3 X transcript 2 transcript 3 probe 2 probe 2 (25 bases, 96% identity) (25 bases, 100% identity) • Unique mappings (alignments) of probes to individual exons (Sanchez-Graillet et al.,2008. Widespread existence of uncorrelated probe intensities from within the same probeset on Affymetrix GeneChips. In Journal of Integrative Bioinformatics, 5(2):98) : • avoid cross-hybridization and multiple targeting. • sense direction (antisense is avoided).
(B,C) Identification of probes containing SNPs and outlier SNP probes
3'UTR transcript 1 Gene 1 transcript 2 3'downstream 3' 5' Chromosome 10 transcript 3 Gene 2 5'upstream snp_id chrom_name chrom_position allele gene_id trans_id biotype rs11000776 rs11000776 rs11000776 10 10 10 75213225 75213225 75213225 G/A G/A G/A ENSG00000172586 ENSG00000172586 ENSG00000212959 ENST00000372837 ENST00000372833 ENST00000391642 3downstream 3utr 5upstream • SNPs data downloaded from Ensembl 48 : • 3' UnTranslated Region, 5' UTR, and coding regions.
Identification of exons with SNPs by using transcript information and chromosomic positions. • Selection of unique exons and probes: • Only unique exons with more than 4 probes. • SNP positions on the probes uniquely mapping to exons are obtained.
Identification of SNP-probes which are outliers: • The overall correlation matrix median (OMM) is compared with each SNP-probe median (SPM). • If OMM – SPM >= 0.15
OMM 0.87 SPM_8 0.84 SPM_9 0.21 Difference 0.03<0.15 0.66>0.15 SNP in an no-outlier probe SNP in an outlier probe
ENSE00001454795HG_U133_Plus_2 O N N N N
Probe position heatmap probe_id snp_id snp position allele sequence Outlier 10 1045_s_at-109-625 rs45612038 14 T/C CTTCAAGAGCATCATGAAGAAGAGT O 9 1045_s_at-237-557 rs45612038 16 T/C ACCTTCAAGAGCATCATGAAGAAGA O 8 1045_s_at-357-497 rs45612038 18 T/C AGACCTTCAAGAGCATCATGAAGAA N 7 1045_s_at-586-137 rs45612038 20 T/C TGAGACCTTCAAGAGCATCATGAAGN 6 1045_s_at-233-503 rs45612038 23 T/C ATATGAGACCTTCAAGAGCATCATG N 5 1045_s_at-153-611 rs45612038 25 T/C ACATATGAGACCTTCAAGAGCATCAN ENSE00001191156 HG_U95A SNP in overlapped probes. The same SNP is in outlier probes and no-outliers probes W.Langdon Wed May 14 10:54:31 BST 2008
snp_id probe_id probe_position_heatmap snp_position_probe allele seq rs11038 221667_s_at-512-441 10 13 A/G GTTTATGATCTGACCTAGGTCCCCC N rs6413487 221667_s_at-570-641 9 7 C/G TAAGGACGCTGGGAGCCTGTCAGTT N ENSE0000129003HG_U133ASNPs in only no-outlier probes
snp_id probe_id probe_position_heatmap snp_position_probe allele sequence rs13505 219768_at-2-233 8 24 C/A CTGAATTTAGATCTCCAGACCCTGC O rs13505 219768_at-602-267 9 4 C/A CCTGCCTGGCCACAATTCAAATTAA O ENSE00001416163 HG_U133A(5,374 CEL files) SNP in only outlier probes
snp_id probe_id probe_position_heatmap snp_position_probe allele sequence rs13505 219768_at-765-395 8 24 C/A CTGAATTTAGATCTCCAGACCCTGC N rs13505 219768_at-507-443 9 4 C/A CCTGCCTGGCCACAATTCAAATTAA O ENSE00001416163HG_U133_Plus_2 (2,572 CEL files) SNP in both outlier and no-outlier probes
snp_id probe_id probe_position_heatmap snp_position_probe allele sequence rs13505 219768_at-432-225 8 24 C/A CTGAATTTAGATCTCCAGACCCTGC N rs13505 219768_at-534-259 9 4 C/A CCTGCCTGGCCACAATTCAAATTAA N ENSE00001416163 HG_U133A_2(159 CEL files) SNP in only NO-outlier probes
~60,000 SNPs distributed in unique exons of ten array designs. • 11% in unique exons in which all probes that contain the same SNP are outliers. • 5% in which not all the probes containing the same SNP are outliers. • 84% in which all probes are not outliers. • These numbers may vary according to the Ensembl version used and the threshold for outliers chosen.
Examination of SNP-Outlier Associations Cross-validation for HG_U133_Plus_2
Median differences and positions of SNPs on probes in HG_U133_Plus_2
Median differences and main alleles (A,C,T,G) found in SNPs in HG_U133_Plus_2
We have identified other causes of outlier probes: • Probes containing a contiguous run of 4 or more guanines: formation of G-quadruplexes occurring on the surface of a GeneChip. (Upton et al., BMC Genomics (in press)). • Probes located next to bright probes, such as at the edge of the Genechip, are affected by blur. • Motifs or any other “problematic” subsequences.
Gs, CCTCC CCACC, GGTGG • Outlier SNP-probes in HG_U133_Plus_2 with “problematic” sub sequences (PS): • G’s (>=4), CCTCC, CCACC, GGTGG Outlier probes No-outlier probes
We have not found a common behaviour when SNPs are present in a probe. • SNPs do not seem to cause outliers in groups of probes representing individual exons. • SNPs may influence other biological events like alternative poly(A). • The genomic region where SNPs are found, the position of the SNP in a probe, the main allele, and the number of SNPs in a probe does not make a probe an outlier in the correlation heatmap.
Bioinformatics Group Dr Andrew Harrison Physics Dr Berthold Lausen Statistics Dr Abdel Salhi Mathematics Professor Graham Upton Statistics Dr William Langdon Physics and Computer Sc. Dr Olivia Sanchez Computer Sc. Dr Maria Stalteri Inorganic Chemistry & Bioinformatics Jose Arteaga-Salas Statistics Rohmatul Fajriyah Statistics Abdelhak Kheniche Pharmacology & Mathematics Rahim Bux Khokhar Mathematics Zain-Ul-Abdin Khurho Mathematics Farhat Memon Computer Sc. Joanna Rowsell Mathematics
Adjacent probes within a cell on a GeneChip have the same sequence – a run of Guanines will result in closely packed DNA with just the right properties to form quadruplexes.