Download
1 / 78
780 likes | 964 Vues
Advances in VA Utilization and Cost Data. Mark W. Smith Paul Barnett Todd Wagner. VA HSR&D National Meeting February 16, 2005. Outline. Overview DSS NDEs vs. HERC average cost data DSS intermediate product data NPPD prosthetics data 4. Fee Basis data. VA Utilization.

E N D
Advances in VA Utilization and Cost Data Mark W. Smith Paul Barnett Todd Wagner VA HSR&D National Meeting February 16, 2005
Outline • Overview • DSS NDEs vs. HERC average cost data • DSS intermediate product data • NPPD prosthetics data • 4. Fee Basis data Health Economics Resource Center
VA Utilization Non-VA Utilization Study objectives and data needs Patient costs Health Economics Resource Center
HERC Annual Person-level costs Encounter Level VA Utilization DSS Intermediate Product Specialty care: e.g., prosthetics Health Economics Resource Center
Rehab, MH, LTC HERC Annual Person-level costs Bedsecn Med/surg Discharge HERC Opat Encounter Level VA Utilization Pharmacy DSS TRT DSS Intermediate Product Discharge Specialty care: e.g., prosthetics Opat Health Economics Resource Center
Rehab, MH, LTC HERC Annual Person-level costs Bedsecn Med/surg Discharge HERC Opat Encounter Level VA Utilization Pharmacy DSS TRT DSS Intermediate Product Discharge Specialty care: e.g., prosthetics Opat Health Economics Resource Center
easy PTF Bedsection files Rehab, MH, LTC hard Med/surg PTF Main files easy Discharge HERC NPCD easy Outpatient very hard PTF Bedsection files TRT DSS easy Discharge PTF Main files Opat moderate NPCD Health Economics Resource Center
Fee Basis Paid by VA Contract Care Non -VA Utilization Medicare/ Medicaid Not paid by VA Private Insurance Out of pocket Health Economics Resource Center
HERC vs DSS Todd Wagner
HERC or DSS • Strategies for choosing dataset • Cost determination method • VA versus non-VA Relative value units • Ease of use Health Economics Resource Center
Cost Determination Method • DSS costs are created using an activity-based costing allocation method • HERC is created using a mixture of methods • Advantage: • Inpatient: DSS • Outpatient: Tie Health Economics Resource Center
RVU-based decision • DSS is based on VA relative value units (RVUs); hospitals can modify RVUs • HERC is based on non-VA RVUs (mostly Medicare) • Advantage: depends on audience (slight advantage to HERC) Health Economics Resource Center
Ease of Use • HERC annual person level is easy to use • HERC discharge dataset merges to PTF main • Has subtotal costs and LOS for HERC categories • Advantage HERC • Caveat: HERC may not exist forever Health Economics Resource Center
Accuracy • Is one more accurate? • Don’t confuse precision and accuracy Health Economics Resource Center
Accuracy • Hard to quantify accuracy of cost data • Quality changes over time • Varies by medical center and type of care • True costs are unknown • Comparisons to other VA or non-VA costs (construct validity) • Understand the production costs Health Economics Resource Center
Outliers • DSS is more subject to outliers than HERC • DSS tries to weed out high cost outliers in production data Health Economics Resource Center
Identifying Inpatient Outliers • Decompose the discharge data • Rehab, MH, LTC: • Calculate a per diem cost • Multiply per diem by LOS • Compare estimated cost to cost • Med/surg • Calculate cost per DRGwt per day; flag records with >$50000 Health Economics Resource Center
Summary • Choice of data should be based on: • The precision you need • Level of detail • Your audience • Choose a primary database (HERC or DSS) • Don’t mix and match DSS and HERC • Except for HERC with DSS pharmacy Health Economics Resource Center
Accuracy and Outliers • No easy solution • Consider: • Comparing costs to other another cost dataset • Investigate DSS production data • Check accuracy of outliers Health Economics Resource Center
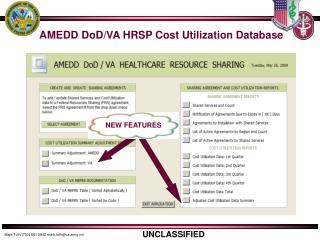
Remainder of Workshop • DSS Intermediate Product data: • - Greater granularity on procedures • National Prosthetics Patient Database (NPPD): • - Only source of prosthetics information: cost, type, patients • - Essential for rehab studies, polytrauma patients • Fee Basis data: • - Non-VA costs excluded from HERC average cost data • - Most non-VA costs excluded from DSS • - Useful for studying outsourcing of care, home-based care Health Economics Resource Center
DSS Intermediate Product Detail: Looking Inside the Black Box • Paul G. Barnett PhD • Shuo Chen PhD Health Economics Resource Center
DSS National Data Extracts • National files available at VA national computing center in Austin, TX • Hospital stays • Bed section segment of a stay • Days in outpatient clinic • Day of outpatient pharmacy • Dispensed prescriptions Health Economics Resource Center
Data in DSS National Data Extracts • Total cost of an encounter • Some subtotals Health Economics Resource Center
Study questions • Where to DSS cost estimates come from? • Are they accurate? • What is importance of previously identified limitations? Health Economics Resource Center
Where do DSS data come from? DSS VISN Level Production Databases (a “Black Box” to most researchers) Cost of intermediate products, stays, visits Extracts of DSS- SAS Files at Austin Cost of stays and visits Health Economics Resource Center
Where do DSS data come from? • DSS allocates cost to departments • DSS finds quantity of services and products from VISTA (VA electronic medical records) • DSS assigns set of Relative Value Units (RVUs) to each service and product Health Economics Resource Center
Intermediate product • The products (and services) used during a hospital stay or an outpatient encounter, e.g.: • Days in ward • Number of chest x-rays • Minutes in operating room Health Economics Resource Center
Where do DSS data come from? • DSS combines department costs with count of products and RVUs • DSS determines the cost of each intermediate product • DSS sums the costs of all intermediate products used in a stay or visit Health Economics Resource Center
Previously identified problems with DSS cost estimates • “Million dollar” products. • Unit costs errors • Encounters assigned extremely high costs Health Economics Resource Center
Previously identified problems (cont.) • Missing medical procedures • At some sites inpatient medical procedures not recorded in a way that can be extracted by DSS • Medical procedures: endoscopy, cardiac catheterization (expensive procedures not recorded in surgical software package) • May result in an underestimate of costs of some hospital stays and outpatient visits Health Economics Resource Center
Looking inside the “black box” • Goals: • Evaluate if unit cost outliers affect cost estimates • Identify if DSS used information on inpatient medical procedures to assign cost • Where procedure data are missing, find the effect on cost estimates Health Economics Resource Center
Evaluation of DSS cost estimates of stays involving medical procedures • Study population: • Clinical trial participants who had cardiac angioplasty • Method: • Obtained detailed data on cost of each product used in inpatient stays (2001-2002) • Compared to corresponding record in DSS NDE • Studied stays with angioplasty according to PTF • Evaluated intermediate products of these stays Health Economics Resource Center
Access to DSS Intermediate Product Detail • In production level data (in the black box) • No national level extract of intermediate products (data set would be too large) • Access granted by each medical center • Alternative: DSS national program office can extract detail Health Economics Resource Center
Access to DSS Intermediate Product Detail • Requested data from DSS national program office • Hoped to pilot test method for future use by other researchers • 2 year wait to obtain these data • Probably not a viable strategy for other researchers • DSS office not funded to do this work • System not designed to extract data on a cohort Health Economics Resource Center
Comparison of intermediate product detail to national data extract • Costs in intermediate product data nearly matched national data extracts (NDE) • A very few records for products with costs greater than $30,000 had been excluded in tabulating costs to prepare NDE • Evidently “high cost outliers” are filtered out in preparing NDE • Appropriate to exclude these values Health Economics Resource Center
Evaluation of intermediate products on cost estimates • Study of inpatient stays with cardiac angioplasty • Identified 158 inpatient stays in which angioplasty took place according to Patient Treatment File (PTF) • Identified whether stay had intermediate products for “angioplasty”, “PTCA”, or “catheterization”, etc. • Matched stay to “wage index” assigned to geographic area by Medicare Health Economics Resource Center
Evaluation of inpatient costs using intermediate products on cost estimates • Mean cost of a stay was $11,941 • 55/158 stays (35%) had at least one angioplasty product • Regression • Dependent variable: DSS cost • Independent variables: length of stay, wage, days in ICU, and whether DSS included an angioplasty intermediate product • Stay with at least one angioplasty product were assigned $7,404 greater cost Health Economics Resource Center
Study limitations • Hard to evaluate cost or quantity of an intermediate product • products may be characterized differently at each site, according to work processes and organization • Uncertain if we identified all angioplasty products • e.g., generic names: minutes in ambulatory surgery • VA continues to improve methods since study time frame (2001-2002) Health Economics Resource Center
Improved inpatient procedure reporting • New VA mandate that cardiac procedures be recorded as data (not just text) Health Economics Resource Center
A new way to look into the black box • Intermediate Product Department (IPD) Detail • One record with costs incurred in each IPD (Production Unit) during the stay/visit • Gives sum of cost of all products from the department • Does not give quantity or cost of intermediate products • Both inpatient and outpatient files • Located at Austin • Not yet documented • Will allow researchers to estimate cost subtotals Health Economics Resource Center
Conclusions • DSS is excluding “million dollar products” in building the NDE • Incomplete data on inpatient procedures may result in significant underestimate of the cost of some hospital stays Health Economics Resource Center
Recommendations • Is accurate estimate of cost of stays involving inpatient procedures important to study? • See DSS IPD extract to see if costs assigned to appropriate intermediate product department Health Economics Resource Center
Recommendations • Alternatives • Use HERC cost estimates as primary, especially if data are several years old. • Conduct sensitivity analysis using HERC estimates • Estimate a cost function with DSS data and use it to simulate missing cost data Health Economics Resource Center
Alternatives (cont.) • Estimate costs using DSS cost function • Estimate cost function • Data: stays that have costs based on appropriate IPD • Independent variables: Use clinical characteristics, LOS, days in ICU, wage index, etc. • Predict costs based on clinical characteristics • In our example, we would have added about $7,400 to cost estimates Health Economics Resource Center
Overview of Fee Basis Program • Pays for care at non-VA facilities in three situations: • VA cannot provide the care locally • It is economical to do so • Travel to a VA facility is medically infeasible Health Economics Resource Center
Overview of Fee Basis Program • Limited emergent care: • - no more than 10-day supply of Rx • - inpatient only until transfer is medically feasible, typically 3 days or less • Full range of services covered Health Economics Resource Center
Overview of Fee Basis Program • Some common uses: • Community nursing home care • Home-based care • E.g.: long-term oxygen therapy • Compensation & pension exams Health Economics Resource Center
Fee Basis files • Subset of all VA contract care • Most “sharing agreement” care from affiliate universities is not included • Substantial non-VA utilization unaccounted for Health Economics Resource Center
Fee Basis Payments FY2003 • Service type Fee Basis Payments • Frequency • Inpatient 116,000 stays $ 545 m • Non-Rx Outpatient 5,418,000 visits $ 477 m • Rx 15,000 scripts $ 0.6 m • TOTAL $ 1,023 m Health Economics Resource Center