Download
1 / 6
60 likes | 69 Vues
Because radon gas is colorless and odorless, it is impossible for humans five senses to know whether one is exposed to it and as it is an inert gas that is nine times heavier than air it is prone to accumulation after being brought into the room through cracks in old buildings, connections and drains, thus creating indoor radon exposure problem. Although indoor radon concentration is related to indoor temperature and humidity, no research has been conducted to actually control indoor temperature and humidity, and to find out how changes in indoor temperature and relative humidity have affected indoor radon concentration. In this paper, we experimented with varying temperature and relative humidity respectively to certain conditions in the laboratory where the thermo hygrostat is installed, and using the results of the measured experiment, the relation between indoor temperature, and relative humidity and indoor radon concentration was explored. Jai-Won Chung | Tae-In Hyon | Gyu-Sik Kim ""Effect of Temperature and Humidity on Indoor Radon Concentration"" Published in International Journal of Trend in Scientific Research and Development (ijtsrd), ISSN: 2456-6470, Volume-4 | Issue-2 , February 2020, <br><br>URL: https://www.ijtsrd.com/papers/ijtsrd30128.pdf<br><br>Paper Url : https://www.ijtsrd.com/engineering/electrical-engineering/30128/effect-of-temperature-and-humidity-on-indoor-radon-concentration/jai-won-chung<br>

E N D
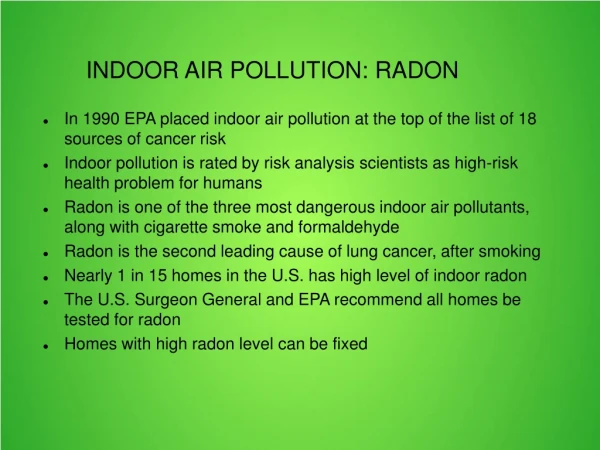
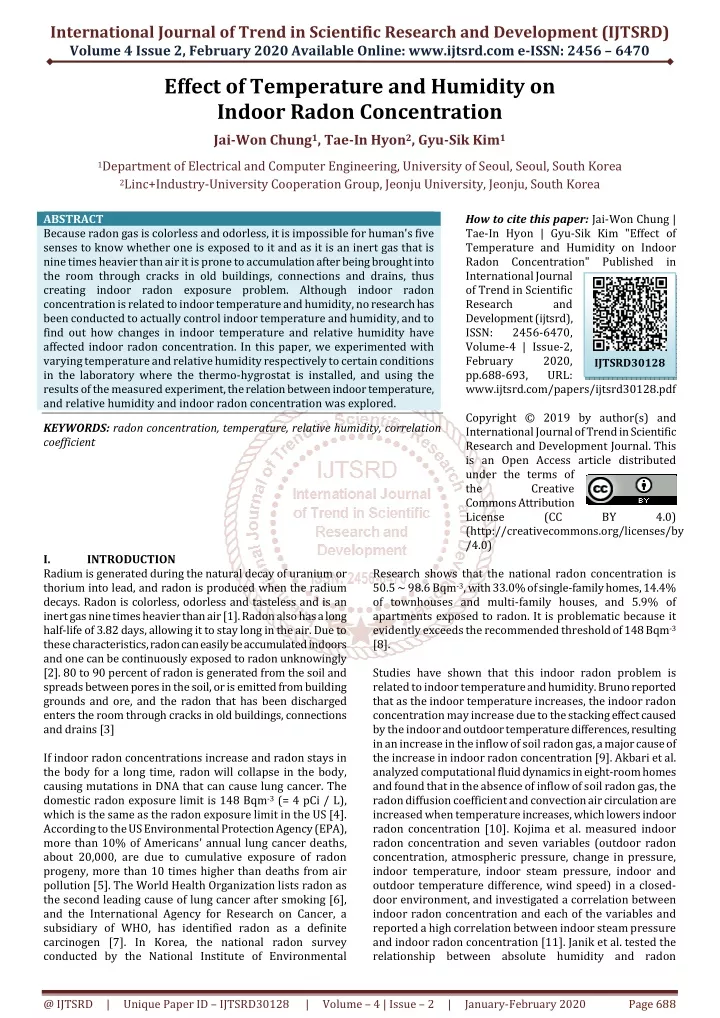
International Journal of Trend in Scientific Research and Development (IJTSRD) Volume 4 Issue 2, February 2020 Available Online: www.ijtsrd.com e-ISSN: 2456 – 6470 Effect of Temperature and Humidity on Indoor Radon Concentration Jai-Won Chung1, Tae-In Hyon2, Gyu-Sik Kim1 1Department of Electrical and Computer Engineering, University of Seoul, Seoul, South Korea 2Linc+Industry-University Cooperation Group, Jeonju University, Jeonju, South Korea ABSTRACT Because radon gas is colorless and odorless, it is impossible for human's five senses to know whether one is exposed to it and as it is an inert gas that is nine times heavier than air it is prone to accumulation after being brought into the room through cracks in old buildings, connections and drains, thus creating indoor radon exposure problem. Although indoor radon concentration is related to indoor temperature and humidity, no research has been conducted to actually control indoor temperature and humidity, and to find out how changes in indoor temperature and relative humidity have affected indoor radon concentration. In this paper, we experimented with varying temperature and relative humidity respectively to certain conditions in the laboratory where the thermo-hygrostat is installed, and using the results of the measured experiment, the relation between indoor temperature, and relative humidity and indoor radon concentration was explored. KEYWORDS: radon concentration, temperature, relative humidity, correlation coefficient How to cite this paper:Jai-Won Chung | Tae-In Hyon | Gyu-Sik Kim "Effect of Temperature and Humidity on Indoor Radon Concentration" Published in International Journal of Trend in Scientific Research and Development (ijtsrd), ISSN: 2456-6470, Volume-4 | Issue-2, February 2020, pp.688-693, URL: www.ijtsrd.com/papers/ijtsrd30128.pdf Copyright © 2019 by author(s) and International Journal of Trend in Scientific Research and Development Journal. This is an Open Access article distributed under the terms of the Creative Commons Attribution License (CC (http://creativecommons.org/licenses/by /4.0) IJTSRD30128 BY 4.0) I. Radium is generated during the natural decay of uranium or thorium into lead, and radon is produced when the radium decays. Radon is colorless, odorless and tasteless and is an inert gas nine times heavier than air [1]. Radon also has a long half-life of 3.82 days, allowing it to stay long in the air. Due to these characteristics, radon can easily be accumulated indoors and one can be continuously exposed to radon unknowingly [2]. 80 to 90 percent of radon is generated from the soil and spreads between pores in the soil, or is emitted from building grounds and ore, and the radon that has been discharged enters the room through cracks in old buildings, connections and drains [3] If indoor radon concentrations increase and radon stays in the body for a long time, radon will collapse in the body, causing mutations in DNA that can cause lung cancer. The domestic radon exposure limit is 148 Bqm-3 (= 4 pCi / L), which is the same as the radon exposure limit in the US [4]. According to the US Environmental Protection Agency (EPA), more than 10% of Americans' annual lung cancer deaths, about 20,000, are due to cumulative exposure of radon progeny, more than 10 times higher than deaths from air pollution [5]. The World Health Organization lists radon as the second leading cause of lung cancer after smoking [6], and the International Agency for Research on Cancer, a subsidiary of WHO, has identified radon as a definite carcinogen [7]. In Korea, the national radon survey conducted by the National Institute of Environmental INTRODUCTION Research shows that the national radon concentration is 50.5 ~ 98.6 Bqm-3, with 33.0% of single-family homes, 14.4% of townhouses and multi-family houses, and 5.9% of apartments exposed to radon. It is problematic because it evidently exceeds the recommended threshold of 148 Bqm-3 [8]. Studies have shown that this indoor radon problem is related to indoor temperature and humidity. Bruno reported that as the indoor temperature increases, the indoor radon concentration may increase due to the stacking effect caused by the indoor and outdoor temperature differences, resulting in an increase in the inflow of soil radon gas, a major cause of the increase in indoor radon concentration [9]. Akbari et al. analyzed computational fluid dynamics in eight-room homes and found that in the absence of inflow of soil radon gas, the radon diffusion coefficient and convection air circulation are increased when temperature increases, which lowers indoor radon concentration [10]. Kojima et al. measured indoor radon concentration and seven variables (outdoor radon concentration, atmospheric pressure, change in pressure, indoor temperature, indoor steam pressure, indoor and outdoor temperature difference, wind speed) in a closed- door environment, and investigated a correlation between indoor radon concentration and each of the variables and reported a high correlation between indoor steam pressure and indoor radon concentration [11]. Janik et al. tested the relationship between absolute humidity and radon @ IJTSRD | Unique Paper ID – IJTSRD30128 | Volume – 4 | Issue – 2 | January-February 2020 Page 688
International Journal of Trend in Scientific Research and Development (IJTSRD) @ www.ijtsrd.com eISSN: 2456-6470 exhalation rate of building materials by placing bricks and granite in the chamber and changing the absolute humidity and reported that the radon emission rate of materials tended to increase as absolute humidity increased [12]. Although such changes in indoor temperature and humidity can affect indoor radon concentration, no study was conducted to determine the effect of room temperature and relative humidity on indoor radon concentration by measuring only temperature and relative humidity in actual indoor environment. In this paper, the effect of changes in room temperature and relative humidity on indoor radon concentration was investigated experimentally. A total of nine experiments were conducted in the laboratory where the thermo- hygrostat was installed, varying the temperature and relative humidity respectively to certain conditions, and the relationship between indoor temperature, relative humidity and indoor radon concentration was explored using the statistical analysis. II. Main Results 2.1.Experiment method Figure 1 shows the temperature and humidity sensor module used in the experiment. The temperature and humidity sensor module was implemented using the Arduino Mega 2560 and the DHT22 (Aosong Electronics Co., China) sensor that can measure temperature and relative humidity. For DHT22 sensors, the measurement error is ±0.5°C at the temperature range of -40°C to 80°C, and the measurement error is ±2% at the relative humidity range of 0% to 100%. Temperature and humidity sensors were set to measure temperature and relative humidity every 1 minute. The high precision radon concentration measuring equipment RAD7 (DURRIDGE Company Inc., USA) was used to measure the concentration of radon during the experiment, and a dehumidifying filter was used for the measurement to remove the effects of humidity, and the concentration of radon was set to be measured every hour. To find out the effect of temperature and relative humidity changes on indoor radon concentration, the thermo- hygrostat was used to set the temperature at 10°C, 20°C, 30°C, and the relative humidity at 20%, 50%, and 80%, respectively, and the temperature, relative humidity and radon concentration were measured under each condition, resulting in a total of nine experiments. EPA recommends that indoor radon concentration measurements be done under closed conditions 12 hours prior to measurement and continuous-type radon measurement equipment should be measured continuously for at least 48 hours [13]. Therefore, after measuring a total of 84 hours per experiment, data from the beginning of the measurement to 12 hours were not used, and 72 hours of subsequent data were used to analyze the effects of relative humidity and temperature. Figure 2 shows the temperature, relative humidity and radon concentration values measured for a total of 84 hours at a temperature of 20°C and a relative humidity of 50%. Fig.2. Temperature, relative humidity, and radon concentration values measured for a total of 84 hours at a temperature of 20 ° C and a relative humidity of 50% 2.2.Analysis and Discussion For each of the nine experiments, the results were analyzed using measured temperature, relative humidity and radon concentration measurements for 72 hours each. For temperature and relative humidity, the temperature and humidity sensor module averaged the measured values that were taken at a minute interval over each hour. For radon concentration, the values measured at intervals of one hour in RAD7 were used. To evaluate the effect of temperature and relative humidity on indoor radon concentration, the Spearman correlation coefficient of temperature and relative humidity were obtained respectively. Table 1 shows the average and standard deviation values of temperature, relative humidity, radon concentration, measured at intervals of one hour for a total of 72 hours for each experiment. In each experiment, the measured mean and standard deviation values of the temperature and the relative humidity, respectively, confirmed that the temperature and relative humidity adhered to the conditions set during the experiment. A maximum mean radon concentration of 68.34 Bqm-3 was measured with a minimum set temperature of 10°C and a maximum set relative humidity of 80%, and a minimum mean radon concentration of 45.07 Bqm-3 was measured with a maximum set temperature of 30°C and a minimum set relative humidity of 20%. (a) DHT22 (b) Arduino (c) Implemented Temperature Mega 2560 temperature and humidity sensor Fig.1. Temperature and humidity sensor module humidity sensor Module The experiment was conducted in an electrical engineering laboratory on the first floor of the Information Technology Museum at University of Seoul, where thermo-hygrostat AP- DPA-100UE (AR Co., Korea) is installed to maintain constant room temperature and relative humidity conditions. EPA (Environmental Protection Agency) recommends that the measurement equipment be spaced at least 90 cm away from windows or exterior doors, at least 50 cm from the ground, and at least 10 cm from other objects when measuring indoor radon concentrations [5]. Therefore, the measuring equipment was separated by 60cm from the ground using an acrylic box in the center of the laboratory, and the equipment was installed to maintain a distance of at least 10cm from other objects. @ IJTSRD | Unique Paper ID – IJTSRD30128 | Volume – 4 | Issue – 2 | January-February 2020 Page 689
International Journal of Trend in Scientific Research and Development (IJTSRD) @ www.ijtsrd.com eISSN: 2456-6470 Table1. Average ± standard deviation value of the temperature, relative humidity and radon concentration measured for a total of 72 hours for each experiment Experiments Temperature (°C) Relative Humidity (%) Experiment (1) 9.99 ± 0.37 Experiment (2) 21.14 ±0.62 Experiment (3) 29.97± 0.69 Experiment (4) 9.59 ± 0.50 Experiment (5) 19.90 ± 0.49 Experiment (6) 31.12 ± 0.41 Experiment (7) 10.08 ± 0.39 Experiment (8) 20.56 ± 0.55 Experiment (9) 29.56 ± 0.72 Radon Concentration (Bqm-3) 59.37 ± 9.56 51.84 ± 7.14 45.07 ± 9.69 63.14 ± 10.53 56.32 ± 9.85 46.73 ± 7.66 68.34 ± 10.74 59.31 ± 7.85 49.04 ± 9.26 19.66 ± 0.90 20.18 ± 1.18 21.54 ± 0.62 50.92 ± 1.03 50.28 ± 0.86 49.66 ± 1.05 79.58 ± 0.63 80.39 ± 1.12 81.10 ± 0.84 To evaluate the effect of temperature and humidity on the change of indoor radon concentration, the Spearman correlation coefficient of temperature and relative humidity for radon concentration was calculated and the scatter plot was plotted. For the Spearman correlation coefficient of relative humidity and radon concentration, the r value was 0.12 when the P-value was less than 0.05, indicating that there was a slight correlation between the two variables. The Spearman's correlation coefficient of temperature and radon concentration showed an r value of -0.53 when the P-value was less than 0.001, indicating a negative correlation between the two variables. Figure 3 shows the scatter plot of temperature and relative humidity for radon concentration. This shows that there is a negative correlation between temperature and radon concentration, and there is a slight correlation between relative humidity and radon concentration. (a) Temperature and radon concentration (n=648) (b) Relative humidity and radon concentration (n=648) Fig. 3. Scatter plot of temperature and relative humidity for radon concentration Table2. Spearman correlation coefficient of temperature and radon concentration at each relative humidity Spearman correlation coefficient (n=216) r -0.49 p-value Relative Humidity 20% Relative Humidity 50% (n=216) -0.54 ≤ 0.01 Relative Humidity 80% (n=216) -0.56 ≤ 0.01 ≤ 0.01 @ IJTSRD | Unique Paper ID – IJTSRD30128 | Volume – 4 | Issue – 2 | January-February 2020 Page 690
International Journal of Trend in Scientific Research and Development (IJTSRD) @ www.ijtsrd.com eISSN: 2456-6470 Table 2 shows the Spearman's correlation coefficient between temperature and radon concentration at each relative humidity. The correlation coefficient between temperature and radon concentration was -0.49 for relative humidity of 20%, -0.54 for relative humidity of 50%, and -0.56 for relative humidity of 80%, with p-value ≤ 0.01 in all cases. This indicates that under all relative humidity conditions there is a negative correlation between the two variables, and that radon concentration decreases as the room temperature increases. Figure 4 shows the scatter plot of temperature and radon concentration at each relative humidity condition. This confirms that there is a negative correlation between temperature and radon concentration at all relative humidity. (a) 20% relative humidity (n=216) (b) 50% relative humidity (n=216) (c) 80% relative humidity (n=216) Fig. 4. Scatter plot of temperature radon concentration @ IJTSRD | Unique Paper ID – IJTSRD30128 | Volume – 4 | Issue – 2 | January-February 2020 Page 691
International Journal of Trend in Scientific Research and Development (IJTSRD) @ www.ijtsrd.com eISSN: 2456-6470 Table 3 shows the Spearman's correlation coefficients for relative humidity and radon concentration at each temperature. Correlation coefficients between relative humidity and radon concentrations showed that there was a weak positive correlation between the two variables, with r values of 0.23 and 0.32, respectively, at 10 ° C and 20 ° C, all with p-value ≤ 0.01, but at temperature of 30 ° C, the r-value was 0.09 at p-value = 0.172 and no statistically significant correlation was observed. Figure 5 shows the scatter plots of relative humidity and radon concentration at each temperature condition. Through this it can be seen that when the temperature is 10 ° C or 20 ° C there is a weak positive correlation between the relative humidity and radon concentration. When the temperature is 30 ° C, the correlation is not large, but as the relative humidity is increased, the radon concentration is slightly increased. Table3. Spearman correlation coefficient of relative humidity and radon concentration at each temperature Spearman correlation coefficient (n=216) r 0.23 p-value Temperature 10°C Temperature 20°C (n=216) 0.32 ≤ 0.01 Temperature 30°C (n=216) 0.09 0.17 ≤ 0.01 (a) 10 ° C temperature (n=216) (b) 20 ° C temperature (n=216) (c) 30 ° C temperature (n=216) Fig. 5. Scatter plot of relative humidity and radon concentration @ IJTSRD | Unique Paper ID – IJTSRD30128 | Volume – 4 | Issue – 2 | January-February 2020 Page 692
International Journal of Trend in Scientific Research and Development (IJTSRD) @ www.ijtsrd.com eISSN: 2456-6470 [3]R.C. Bruno, “Sources of indoor radon in houses: a review”, Journal of the Air Pollution Control Association, Vol.33, No.2, pp.105-109, 1983. III. In this study, the effects of room temperature and relative humidity on the indoor radon concentration were experimentally investigated. In the case of room temperature and radon concentration, radon concentration tended to decrease with increasing temperature regardless of relative humidity. In the absence of soil radon gas inflows, an increase in indoor temperature can reduce indoor radon concentration by increasing convective air circulation and radon diffusion coefficients, thereby reducing the indoor radon concentration [10]. For this reason, the radon concentration tends to decrease with increasing room temperature. In the case of relative humidity, the radon concentration tended to increase as the relative humidity increased except in the case where the temperature was 30 ° C. Increased humidity may increase the amount of radon gas emitted from building materials such as bricks and cements [12]. For this reason, indoor radon concentrations tended to increase with relative humidity. However, it was found that temperature had a greater effect on indoor radon concentration than relative humidity. For the effects of temperature and relative humidity changes on indoor radon concentrations, the propensity and degree of influence may vary depending on the location or environment of measurement. Therefore, further research in various places and environments is deemed to be necessary. Acknowledgment This work was also supported by the National Research Foundation of Korea (NRF) grant funded by the Korea government (MSIP) (No. 2019R1H1A 2101157). References [1]NCRP (National Council on Radiation Protection and Measurements), “Measurement of radon and radon daughters in air”, Recommendations of the National Council on Radiation Protection and Measurements. Bethesda, No.97, 1988. Conclusion [4]Korea Environment Corporation, "Internal Radon Management," Korea Environment Corporation, 2016. [5]United States Environmental Protection Agency (USEPA), “A Citizen’s Guide to Radon”, USEPA, EPA/402/K-12/002, 2012. [6]World Health Organization (WHO), “Handbook on Indoor Radon”, WHO Press., Geneva, 2009. [7]International Agency for Research on Cancer, “Man- made mineral fibres and radon: summary of data reported and evaluation”, IARC monographs, Vol.43, 1988. [8]Ministry of Environment of Republic of Korea (MoE), “Development of Radon Mitigation Standard Manual by Building Types”, MoE, 2013. [9]R.C. Bruno, "Sources of indoor radon in houses: a review", Journal of the Air Pollution Control Association, vol. 33, no. 2, pp. 105-109, 1983. [10]Environmental K. Akbari, J. Mahmoudi, M. Ghanbari, “Influence of indoor air conditions on radon concentration in a detached house”, Journal of environmental radioactivity”, vol. 116, pp. 166-173, 2013. [11]H. Kojima, S. Abe, “Effect of Humidity to the Variation of Radon Daughter Concentration in a building”, Japanese Journal of Health Physics, vol. 20, no. 4, pp. 379-383, 1985. [12]M. Janik, Y. Omori, H. Yonehara, “Influence of humidity on radon and thoron exhalation rates from building materials”, applied radiation and Isotopes, vol. 95, pp. 102-107, 2015. [13]Environmental Protection Agency (EPA), “Indoor Radon and Radon Decay Product Measurement Device Protocol“, EPA 402-R-92-004, 1992. [2]International Commission on Radiological Protection (ICRP), “Radiological protection against radón exposure, ICRP Publication 126”, ICRP, Vol.43, No.3, 2014. @ IJTSRD | Unique Paper ID – IJTSRD30128 | Volume – 4 | Issue – 2 | January-February 2020 Page 693