Download
1 / 9
100 likes | 109 Vues
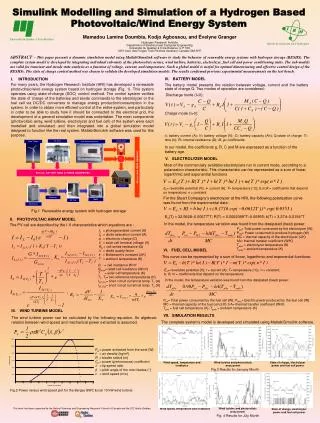
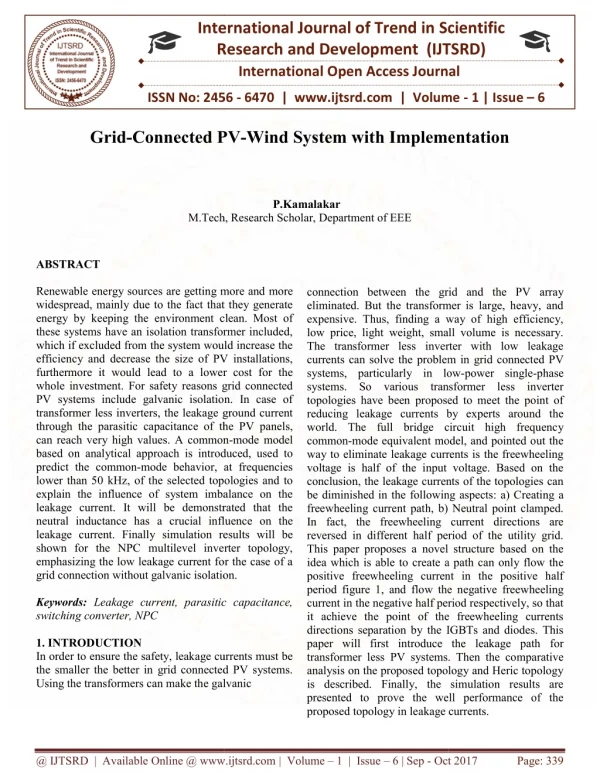
In this paper, a grid connected hybrid power system comprising wind and solar based renewable energy sources RERs is proposed. As these RERs are intermittent and random in nature, so a backup source is needed for smoothening the fluctuations in RERs output power. Battery energy storage BESS is proposed for this purpose. The electrical grid of the example represents a typical Utility distribution system. It consists of a 120 kV transmission system equivalent supplying a 25 kV distribution substation. Several feeders are connected to the 25 kV bus of the substation. One of them supplies the power to a community that owns the PV farm and an energy storage system. The grounding transformer connected at the 25 kV bus provides a neutral point and limits the overvoltage on the healthy phases during a single phase fault. Its zero sequence impedance is three times the value of the grid positive sequence impedance. Ajaz Ul Haq "Modelling and Simulation of Energy Storage System for Grid-Connected Wind-PV System" Published in International Journal of Trend in Scientific Research and Development (ijtsrd), ISSN: 2456-6470, Volume-3 | Issue-1 , December 2018, URL: https://www.ijtsrd.com/papers/ijtsrd19048.pdf Paper URL: http://www.ijtsrd.com/engineering/electrical-engineering/19048/modelling-and-simulation-of-energy-storage-system-for-grid-connected-wind-pv-system/ajaz-ul-haq<br>

E N D
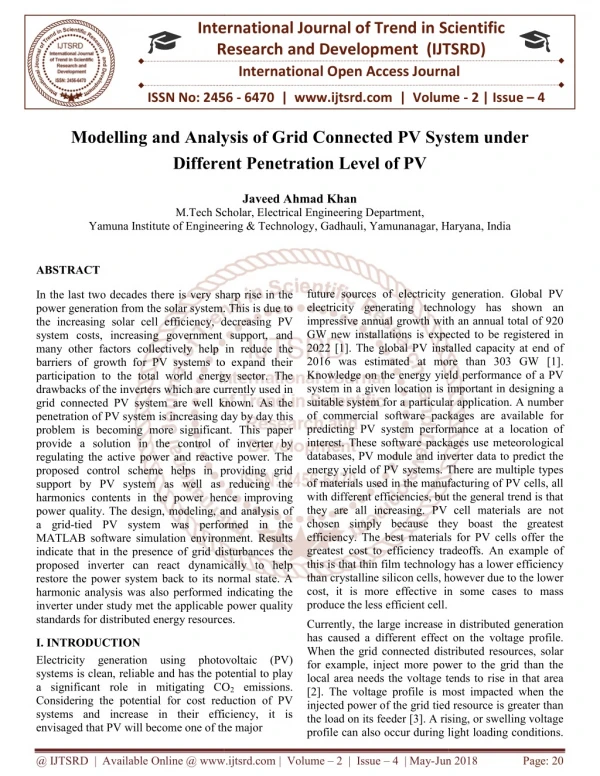
International Journal of Trend in International Open Access Journal International Open Access Journal | www.ijtsrd.com International Journal of Trend in Scientific Research and Development Research and Development (IJTSRD) www.ijtsrd.com ISSN No: 2456 ISSN No: 2456 - 6470 | Volume - 3 | Issue – 1 | Nov 1 | Nov – Dec 2018 Modelling and Simulati Grid-Connected Wind Connected Wind-PV System Modelling and Simulation of Energy Storage System for on of Energy Storage System for Ajaz Ul Haq M.Tech Scholar, Electrical Engineering Department YIET, Gadhauli YIET, Gadhauli, Yamunanagar, Haryana, India M.Tech Scholar, Electrical Engineering Department ABSTRACT In this paper, a grid connected hybrid power system comprising wind and solar based renewable energy sources (RERs) is proposed. As these RERs intermittent and random in nature, so a backup source is needed for smoothening the fluctuations in RERs output power. Battery energy storage (BESS) is proposed for this purpose. The electrical grid of the example represents a typical Utility distribu system. It consists of a 120-kV transmission system equivalent supplying a 25-kV distribution substation. Several feeders are connected to the 25- substation. One of them supplies the power to a community that owns the PV farm and an ener storage system. The grounding transformer connected at the 25-kV bus provides a neutral point and limits the overvoltage on the healthy phases during a single phase fault. Its zero-sequence impedance is three times the value of the grid positive sequenc impedance. I. INTRODUCTION Fossil fuels (oil, coal and natural gas) have been throughout history, the backbone on which industrial activity has been developed and nowadays, they are the main energy resource of an industrialized society and also they have been the responsible of inequalities between countries with a limited access to this kind of resources, hindering their development. Figure 1 shows how fossil fuels supplied the highest amount of energy in 2017, however, this energy model has seen its days because the reserves of these fuels are declining, and in accordance with studies of the IEA (International Energy Agency), the demand of energy will continue growing due to the reliance on technology, enhanced living standards of developed countries and continuous increase of population in the developing countries [2]. II. MICROGRID COMPONENTS A microgrid includes distributed energy resource (DER) (photovoltaics, small wind turbines, fuel cells, internal combustion engines, microturbines, etc.), distributed energy storage devices (flywheels, superconductor inductors, batteries, etc.), and loads. DERs can be divided into two main groups: (i) DER directed-coupled conventional rotating machines (e.g., an induction generator driven by a fixed turbine), and (ii) DER grid-coupled with the inverter (e.g. Photovoltaic, fuel cells, etc.). Distributed energy storage devices can be charged with the power excess and discharge to cover the power deficit. Thus, they help to enhance the reliability of making it efficient and economical. Furthermore, energy storage is known as fast response devices. Therefore, they also prevent transient instability and participate to control the voltage and the frequency of the microgrid by providing the balance reserve ranging from short time. The diagram of a microgrid which includes many systems: PV, a variable wind generator, fuel cell, microturbine and a battery energy storage system is shown in Figure 1. Each distributed energy resource corresponding bus through a power converter. The microgrid is connected to the upstream network at the Point of common coupling (PCC). The power is furnished from a Low transmission grid, through a substation The microgrid operates with two modes: the grid connected mode and the islanded mode. In the grid connected mode, the PCC is closed and the microgrid is connected with the main grid. It leads that the microgrid can exchange energy with the mai When the upstream network occurs the disturbance or the microgrid gets the optimal operation state, the switch at PCC can be opened to disconnect the switch at PCC can be opened to disconnect the MICROGRID STRUCTURE STRUCTURE AND AND In this paper, a grid connected hybrid power system comprising wind and solar based renewable energy sources (RERs) is proposed. As these RERs are intermittent and random in nature, so a backup source is needed for smoothening the fluctuations in RERs output power. Battery energy storage (BESS) is proposed for this purpose. The electrical grid of the example represents a typical Utility distribution A microgrid includes distributed energy resource (DER) (photovoltaics, small wind turbines, fuel cells, internal combustion engines, microturbines, etc.), distributed energy storage devices (flywheels, superconductor inductors, batteries, etc.), and loads. DERs can be divided into two main groups: (i) DER coupled conventional rotating machines (e.g., an induction generator driven by a fixed-speed wind kV transmission system kV distribution substation. -kV bus of the coupled with the inverter (e.g. Photovoltaic, fuel cells, etc.). Distributed energy storage devices can be charged with the power excess and discharge to cover the power deficit. Thus, they help to enhance the reliability of microgrid as well as making it efficient and economical. Furthermore, energy storage is known as fast response devices. Therefore, they also prevent transient instability and participate to control the voltage and the frequency of substation. One of them supplies the power to a community that owns the PV farm and an energy storage system. The grounding transformer connected kV bus provides a neutral point and limits the overvoltage on the healthy phases during a single- sequence impedance is three times the value of the grid positive sequence ng the balance reserve ranging from short time. The diagram of a microgrid which includes many systems: PV, a variable-speed wind generator, fuel cell, microturbine and a battery energy storage system is shown in Figure 1. Each distributed energy resource is interfaced with its corresponding bus through a power-electronic converter. The microgrid is connected to the upstream network at the Point of common coupling (PCC). The power is furnished from a Low-voltage (LV) transmission grid, through a substation transformer. The microgrid operates with two modes: the grid- connected mode and the islanded mode. In the grid- connected mode, the PCC is closed and the microgrid is connected with the main grid. It leads that the microgrid can exchange energy with the main grid. When the upstream network occurs the disturbance or the microgrid gets the optimal operation state, the Fossil fuels (oil, coal and natural gas) have been throughout history, the backbone on which industrial activity has been developed and nowadays, they are the main energy resource of an industrialized society been the responsible of inequalities between countries with a limited access to this kind of resources, hindering their development. Figure 1 shows how fossil fuels supplied the highest amount of energy in 2017, however, this energy model has seen because the reserves of these fuels are declining, and in accordance with studies of the IEA (International Energy Agency), the demand of energy will continue growing due to the reliance on technology, enhanced living standards of developed continuous increase of population in the @ IJTSRD | Available Online @ www.ijtsrd.com www.ijtsrd.com | Volume – 3 | Issue – 1 | Nov-Dec 2018 Dec 2018 Page: 591
International Journal of Trend in Scientific International Journal of Trend in Scientific Research and Development (IJTSRD) ISSN: 2456 Research and Development (IJTSRD) ISSN: 2456-6470 microgrid. Thus, the microgrid can continue to operate in the so called islanded mode. microgrid. Thus, the microgrid can continue to Figure 1: A studied Microgrid structure A studied Microgrid structure Figure 2: The microgrid operation strategies 2: The microgrid operation strategies MICROGRID OPERATION Two operation modes of microgrid can be defined as follows: I. Grid-connected Mode: The microgrid (MG) is connected to the upstream network. The MG can receive totally or partially the energy by the main grid (depending on the power sharing). On the other hand, the power excess can be sent to the main grid (when the total production exceeds consumption). II. Island Mode: When the upstream network has a failure, or there are some planned actions (for example, in order to perform maintenance actions), the MG can smoothly move to islanded operation. Thus, the MG operate autonomously, is called island mode, in a similar way to the electric power systems of the physical islands. Furthermore, the operation of the microgrid may depend on conflicting interests among different stakeholders involved in electricity supply, such as system/network operators, operators, energy suppliers, and so on, as well as customers or regulatory bodies. Optimal operation of microgrid is based on economic, technical, or environmental aspects [1]. The microgrid operation strategies are presented in Figure 2. There are four operational options as follows: Economic option Technical option Environmental option Combined objective option A.The economic option In the economic option, the objective function is to minimize total costs of DER operation and Revenue. This option assumes lost cost and emission obligations. The constraints are expressed as the physical constraints of DER and energy balance. The economic mode of microgrid operation is shown in Figure 3. There are four operational options as follows: Two operation modes of microgrid can be defined as (MG) is connected to the upstream network. The MG can receive totally or partially the energy by the main grid (depending on the power sharing). On the other hand, the power excess can be sent to the main grid (when the total Combined objective option In the economic option, the objective function is to osts of DER operation and Revenue. This option assumes lost cost and emission obligations. The constraints are expressed as the physical constraints of DER and energy balance. The economic mode of microgrid operation is shown in When the upstream network has a failure, or there are some planned actions (for example, in order to perform maintenance actions), the MG can smoothly move to islanded operation. Thus, the MG operate autonomously, is called island mode, in a similar way to the electric power systems of Furthermore, the operation of the microgrid may depend on conflicting interests among different stakeholders involved in electricity supply, such as system/network operators, operators, energy suppliers, and so on, as well as customers or regulatory bodies. Optimal operation of microgrid is based on economic, technical, or environmental aspects [1]. The microgrid operation DG DG owner owners, DER Figure 3: The economic mode of microgrid operation B.The technical option The technical mode of microgrid operation is presented in Figure 4. The power loss is demonstrated as the objective function. The voltage variation and as the objective function. The voltage variation and conomic mode of microgrid operation The technical mode of microgrid operation is presented in Figure 4. The power loss is demonstrated @ IJTSRD | Available Online @ www.ijtsrd.com www.ijtsrd.com | Volume – 3 | Issue – 1 | Nov-Dec 2018 Dec 2018 Page: 592
International Journal of Trend in Scientific International Journal of Trend in Scientific Research and Development (IJTSRD) ISSN: 2456 Research and Development (IJTSRD) ISSN: 2456-6470 device loading, DER physical limits and energy balance are the constraints. physical limits and energy Figure 6: The combined objective mode of microgrid operation 1.Solar cell modelling Solar cell can be modelled as current source (Iph) in parallel with Diode (D), Shunt resistance (Rsh) and series resistance (Rse).Current and voltage profile of the solar cell depends on Atmosphere temperature (T), and irradiance (S). The output power of Photo voltaic cell is given by P=V*I. The current produ PV cell is equal to the current produced by the current source minus the diode and shunt resistance current. The light generated current of Photo voltaic cell depends on the solar irradiation and the temperature. Ish Id Iph I S Tr T Ki ISC Iph Figure 6: The combined objective mode of microgrid operation Figure 4: The technical mode of microgrid operation Figure 4: The technical mode of microgrid operation C.The environmental option The environmental mode of MG operation is shown in Figure 3.5. The DER units with lower specific emission levels will be the target of choice which does not consider the financial or technical aspects. The emission cost is given as the objective of this option. Solar cell can be modelled as current source (Iph) in parallel with Diode (D), Shunt resistance (Rsh) and series resistance (Rse).Current and voltage profile of the solar cell depends on Atmosphere temperature (T), and irradiance (S). The output power of Photo voltaic cell is given by P=V*I. The current produced by the PV cell is equal to the current produced by the current source minus the diode and shunt resistance current. The light generated current of Photo voltaic cell depends on the solar irradiation and the temperature. The environmental mode of MG operation is shown in Figure 3.5. The DER units with lower specific e the target of choice which does not consider the financial or technical aspects. The emission cost is given as the objective of this (1) [ * ( )] * 1000 (2) q ( v i * Rs ) 1 AKT Id Io ( e (3) 1 1 * q * Eg * Tr T 3 T A K Io Ior * * e Tr (4) Figure 3.5: The environmental mode of microgrid operation Figure 3.5: The environmental mode of microgrid I=output current of the PV cell. Iph=cell generated current Id=Diode current Ish=current drawn by the shunt resistance Isc=short circuit of the PV cell. t (0.0032A/k(approx...)) I=output current of the PV cell. Iph=cell generated current Id=Diode current Ish=current drawn by the shunt resistance Isc=short circuit of the PV cell. Ki=short circuit (0.0032A/k(approx...)) temperature in kelvin Tr=reference temperature in kelvin=298k Q=charge of electron=1.9 ∗ 10 S=module irradiance (/m2) Eg=energy band gap=1.1ev A=ideality factor=1.6 K=Boltzmann constant=1.38 ∗ D.The combined option The combined option solves a mu problem to satisfy all of the economic, technical and environmental aspects. The objective function includes the economic and the economic equivalents of the technical and environmental, considering constraints from the voltage variation and DER physical limits and the balance energy. The combine mode of microgrid operation is shown in Figure 6. The combined option solves a multi-objective problem to satisfy all of the economic, technical and environmental aspects. The objective function includes the economic and the economic equivalents of the technical and environmental, considering constraints from the voltage variation and loading, DER physical limits and the balance energy. The combine mode of microgrid operation is shown in temp temp coefficient T=module T=module coefficient of operating operating of cell cell Tr=reference temperature in kelvin=298k 10−19 Eg=energy band gap=1.1ev A=ideality factor=1.6 ∗ 10−23 @ IJTSRD | Available Online @ www.ijtsrd.com www.ijtsrd.com | Volume – 3 | Issue – 1 | Nov-Dec 2018 Dec 2018 Page: 593
International Journal of Trend in Scientific International Journal of Trend in Scientific Research and Development (IJTSRD) ISSN: 2456 Research and Development (IJTSRD) ISSN: 2456-6470 The important parameters of solar cell are open circuit voltage (Voc), short circuit current (Isc), Maximum Output power (Pmax). 2.Equivalent circuit Here is the source current or the solar cell current which is of nearly constant. Id is the diode current, Diode is placed in parallel to ground the cells which are which are affected by the unshaded portion of the sun irradiation. Rsh is to to represent the leakage current that is presented in the cell which is the order of 1000 ohms. Rse is the series resistance to replace the losses present the cell. Vo is the output voltage or the open circuit voltage presented, at the terminals of the cell. Io is the current available at the output of the cell. The equivalent circuit of the solar cell is shown as below. The important parameters of solar cell are open circuit voltage (Voc), short circuit current (Isc), Maximum Short circuit current (Isc) Short circuit current of the cell is the maximum current that will flow under short circuit condition or zero voltage condition, and when the output terminals are short circuited. Short circuit current of the cell directly depends on the solar irradiance and reduces when the PN junction temperature decreases. Typical ratings of Short circuit current of PV panel ranges from 1-10 amps. Series resistance (Rse) Series resistance is placed in the model of solar cell to replace the losses occur in that. If the Rse increases then the losses, voltage drop increases. Which results in the sagging of current controlled portion of I curve. Loss due to PV cell is given by Vrse*Irse or Irse2∗Rse . The value of the Rse is low and nearly less than 1 ohm. Shunt resistance (Rsh) The shunt resistance in the PV cell is to represent the leakage current occur in the cell, generally the value of Rsh is of high value of the order of thousands of ohms. Decreased in the value of Rsh results into the increase in the value of the leakage current, which results into the drop in the net output current intern reduces the open circuit voltage. Reverse saturation current When the output cell current of the PV cell increases then the Voc reduces because the cell temperature increases, there by the reverse saturati the cell increases. Reverse saturation current is effectively known as leakage current. III. SIMULATION A micro-grid (grid-connected PV system) system is modelled and developed in MATLAB/Simulink. The micro-grid in congestion with main grid is de feed a load of a community and simulation is performed for one year as shown in Figure 8. BESS is incorporated to minimize the power outage when main grid or PV system output is not available. The simulation is performed for variable solar irradiance and variable load throughout the year. The optimum size requirement of different components of the proposed system is calculate by taking power outage, overall coat and environmental concerns into consideration. he cell is the maximum current that will flow under short circuit condition or zero voltage condition, and when the output terminals are short circuited. Short circuit current of the cell directly depends on the solar irradiance and reduces ction temperature decreases. Typical ratings of Short circuit current of PV panel ranges Here is the source current or the solar cell current constant. Id is the diode current, Diode is placed in parallel to ground the cells which are which are affected by the unshaded portion of the is to to represent the leakage current that is presented in the cell which is the order 000 ohms. Rse is the series resistance to replace the losses present the cell. Vo is the output voltage or the open circuit voltage presented, at the terminals of the cell. Io is the current available at the output of the Series resistance is placed in the model of solar cell to replace the losses occur in that. If the Rse increases es, voltage drop increases. Which results in the sagging of current controlled portion of I-V curve. Loss due to PV cell is given by Vrse*Irse or Rse . The value of the Rse is low and nearly less e solar cell is shown ce in the PV cell is to represent the leakage current occur in the cell, generally the value of Rsh is of high value of the order of thousands of ohms. Decreased in the value of Rsh results into the increase in the value of the leakage current, which ts into the drop in the net output current intern reduces the open circuit voltage. Figure.7. Equivalent circuit of PV cell Figure.7. Equivalent circuit of PV cell The source current generated the cell is constant, as and when the temperature are constant. As the current generated by the cell depends on the temperature and the solar irradiation. The diode current has the steeply increasing characteristics, with the v output current is the combination of cell current and the diode current, it results in the nonlinear characteristics of the output current and the voltage. 3.Parameters of solar cell Open circuit voltage (Voc) Open circuit voltage is the no load voltage that appears across the terminals of the PV cell. Open circuit voltage voltage of the PV cell depends completely on the temperature (T).If the temperature of the PV cell increases then the output voltage of the solar cell or module decreases. By increasing the no of series cells we can increase the open circuit voltage of the solar module. Typically the open circuit voltage of the cell at temperature 25 degrees is about 0.6v for silicon cell. The source current generated the cell is constant, as and when the temperature are constant. As the current generated by the cell depends on the temperature and the solar irradiation. The diode current has the steeply increasing characteristics, with the voltage. The output current is the combination of cell current and the diode current, it results in the nonlinear characteristics of the output current and the voltage. When the output cell current of the PV cell increases then the Voc reduces because the cell temperature increases, there by the reverse saturation current of the cell increases. Reverse saturation current is effectively known as leakage current. connected PV system) system is d voltage that modelled and developed in MATLAB/Simulink. The grid in congestion with main grid is designed to feed a load of a community and simulation is performed for one year as shown in Figure 8. BESS is incorporated to minimize the power outage when main grid or PV system output is not available. appears across the terminals of the PV cell. Open circuit voltage voltage of the PV cell depends completely on the temperature (T).If the temperature of the PV cell increases then the output voltage of the increasing the no of series cells we can increase the open circuit voltage of the solar module. Typically the open circuit voltage of the cell at temperature 25 degrees is about 0.6v for The simulation is performed for variable solar throughout the year. The optimum size requirement of different components of the proposed system is calculate by taking power outage, overall coat and environmental concerns into @ IJTSRD | Available Online @ www.ijtsrd.com www.ijtsrd.com | Volume – 3 | Issue – 1 | Nov-Dec 2018 Dec 2018 Page: 594
International Journal of Trend in Scientific Research and Development (IJTSRD) ISSN: 2456 International Journal of Trend in Scientific Research and Development (IJTSRD) ISSN: 2456 International Journal of Trend in Scientific Research and Development (IJTSRD) ISSN: 2456-6470 A A A A A A A A c c c c c c c (600V) A c (600V) (600V) <Grid> A Breaker c Figure 8 MATLAB/Simulink model of grid connected PV system Figure 8 MATLAB/Simulink model of grid connected PV system with BESS with BESS A.LOAD CALCULATIONS The load for a community is for summer and winter season. AS expected, in summer season the requirement of the power is more as compared to the winter season. The load is calculated in that manner is shown in Table 1. Table 1. Estimated load for the selected location. The load for a community is for summer and winter season. AS expected, in summer season the requirement of The load for a community is for summer and winter season. AS expected, in summer season the requirement of the power is more as compared to the winter season. The load is calculated in that manner is shown in Table 1. the power is more as compared to the winter season. The load is calculated in that manner is shown in Table 1. Summers (April- October) Hours/Day Winters (November Winters (November- March) Hours/Day Sr. No. No. in Use Power Load (Watts) (Watts) Wh/Day Hours/Day Wh/Day Domestic appliances load 20 10 50 75 1. 2. 3. 4. CFLs CFLs 04 02 02 01 06 05 10 03 480 100 1000 225 07 06 00 03 03 07 06 00 560 120 00 225 Ceiling Fans TVs Water pumps Refrigerators (1×0.25) * Total No. of house 5. 01 500 01 500 0.5 0.5 250 6. A. 500 06 750 00 00 00 3055 1155 435435 332 1151735 Commercial purpose, temples and street light load Commercial purpose, temples and street light load 600 500 50 81000 Schools and primary health center load 20 50 250 14350 1. 2. 3. C. Shops Temples Street lights Total 10 02 30 10 06 10 60000 6000 15000 08 06 12 12 08 06 48000 6000 18000 72000 Schools and primary health center load 1. 2. 3. C. CFLs 40 30 03 02 06 05 1600 9000 3750 03 00 05 05 03 00 2400 00 3750 Ceiling Fans Computers Total 6150 @ IJTSRD | Available Online @ www.ijtsrd.com www.ijtsrd.com | Volume – 2 | Issue – 6 | Sep-Oct 2018 2018 Page: 595
International Journal of Trend in Scientific International Journal of Trend in Scientific Research and Development (IJTSRD) ISSN: 2456 Research and Development (IJTSRD) ISSN: 2456-6470 Figure 9. Daily load profile for a the summer and winter season Figure 9. Daily load profile for a the summer and winter season Figure 9. Daily load profile for a the summer and winter season 5.1. TEMPERATURE PROFILE The temperature profile of the location is one of the factors that is system for that location. Figure 10. shows the temperature profile for that location. As expected, in mid of the year the temperature level is on higher side, whereas in starting and end of the year temperature i side. The temperature profile of the location is one of the factors that is responsible for output generated by the PV system for that location. Figure 10. shows the temperature profile for that location. As expected, in mid of the year the temperature level is on higher side, whereas in starting and end of the year temperature i year the temperature level is on higher side, whereas in starting and end of the year temperature is on lower responsible for output generated by the PV system for that location. Figure 10. shows the temperature profile for that location. As expected, in mid of the Figure 10. Temperature profile of the location Figure 10. Temperature profile of the location 5.2. SOLAR IRRADIANCE PROFILE The output power of PV system is directly proportional to the solar irradiance available at that location. Higher the solar irradiance more will be the output maximum amount of solar irradiance is available and maximum power of the solar system is for those months. maximum amount of solar irradiance is available and maximum power of the solar system is for those months. maximum amount of solar irradiance is available and maximum power of the solar system is for those months. SOLAR IRRADIANCE PROFILE The output power of PV system is directly proportional to the solar irradiance available at that location. Higher the solar irradiance more will be the output power generated by the PV system. In the month of May and June power generated by the PV system. In the month of May and June The output power of PV system is directly proportional to the solar irradiance available at that location. Higher Figure 11 Solar irradiance at the location Figure 11 Solar irradiance at the location 5.3. LOAD PROFILE As per the load calculate din Table.1, the load is maximum in the month of May and June. Figure 12 shows the load profile. ate din Table.1, the load is maximum in the month of May and June. Figure 12 shows the ate din Table.1, the load is maximum in the month of May and June. Figure 12 shows the @ IJTSRD | Available Online @ www.ijtsrd.com www.ijtsrd.com | Volume – 3 | Issue – 1 | Nov-Dec 2018 Dec 2018 Page: 596
International Journal of Trend in Scientific International Journal of Trend in Scientific Research and Development (IJTSRD) ISSN: 2456 Research and Development (IJTSRD) ISSN: 2456-6470 Figure 12 Load profile 5.4. POWER TO/FROM THE GRID If the PV system is not generating enough power to feed the load, power is purchased from the grid. surplus power is available the power is given back to the grid. Figure 13 shows the power flow to/from the grid. surplus power is available the power is given back to the grid. Figure 13 shows the power flow to/from the grid. surplus power is available the power is given back to the grid. Figure 13 shows the power flow to/from the grid. POWER TO/FROM THE GRID If the PV system is not generating enough power to feed the load, power is purchased from the grid. If the PV system is not generating enough power to feed the load, power is purchased from the grid. If there is Figure 5.6 Grid power 5.5. BESS POWER BESS is used for limiting the power outage when PV system and grid power is not available. between the load and supply is the power to/from the BESS. If surplus power is available the BESS is in charging state and if there is requirement of power BESS will provide that power and goes in to discharging state. Figure 14 shows the power profile of the BESS. ower profile of the BESS. BESS is used for limiting the power outage when PV system and grid power is not available. The difference between the load and supply is the power to/from the BESS. If surplus power is available the BESS is in BESS is used for limiting the power outage when PV system and grid power is not available. between the load and supply is the power to/from the BESS. If surplus power is available the BESS is in charging state and if there is requirement of power BESS will provide that power and goes in to discharging charging state and if there is requirement of power BESS will provide that power and goes in to discharging Figure 14 Power flow of BESS State of Charge (SoC) of BESS is also shown in Figure 15. As from the figure it is clear that, in the peak load season, i.e. summer season the BESS goes in frequent charge/discharge state. Whereas d when the load is not as high, BESS is in idle state and remains in its maximum charge state i.e. 90%. when the load is not as high, BESS is in idle state and remains in its maximum charge state i.e. 90%. when the load is not as high, BESS is in idle state and remains in its maximum charge state i.e. 90%. State of Charge (SoC) of BESS is also shown in Figure 15. As from the figure it is clear that, in the peak load season, i.e. summer season the BESS goes in frequent charge/discharge state. Whereas d season, i.e. summer season the BESS goes in frequent charge/discharge state. Whereas during winter season, State of Charge (SoC) of BESS is also shown in Figure 15. As from the figure it is clear that, in the peak load @ IJTSRD | Available Online @ www.ijtsrd.com www.ijtsrd.com | Volume – 3 | Issue – 1 | Nov-Dec 2018 Dec 2018 Page: 597
International Journal of Trend in Scientific International Journal of Trend in Scientific Research and Development (IJTSRD) ISSN: 2456 Research and Development (IJTSRD) ISSN: 2456-6470 Figure 15. SoC of BESS 5.6. COMPAISON OF DIFFERENT POWER The power generated and absorbed by different components of the micro always should be balance between supply and demand for continuous power supply. Figure 16 shows the waveforms of different components of microgrid. This figure shows the daily profile and it can easily be observed by the waveform that if there is any deficiency in the power BESS gets in to discharging mode. If any deficiency still remains then grid will compensate that. On the other hand, if there is surplus power is available the BESS will start charging. COMPAISON OF DIFFERENT POWER The power generated and absorbed by different components of the micro-grid is shown in Figure 5.9. There always should be balance between supply and demand for continuous power supply. Figure 16 shows the waveforms of different components of microgrid. This figure shows the daily profile and it can easily be eform that if there is any deficiency in the power BESS gets in to discharging mode. If any deficiency still remains then grid will compensate that. On the other hand, if there is surplus power is available deficiency still remains then grid will compensate that. On the other hand, if there is surplus power is available d is shown in Figure 5.9. There always should be balance between supply and demand for continuous power supply. Figure 16 shows the waveforms of different components of microgrid. This figure shows the daily profile and it can easily be eform that if there is any deficiency in the power BESS gets in to discharging mode. If any Figure 16. Power Figure 16. Power waveform of different components of microgrid waveform of different components of microgrid proposed to emulate the short distance between solar arrays and the central inverter. For the distribution network, two segments of distribution lines with three-phase resistive load were developed to simplify the real distribution network. The system performance and transient response under disturbance conditions were analyzed in MATLAB. Later on, small signal analysis was also carried out to validate the simulation model. The results showed that the system remain stable under the disturbance and the performance was acceptable. REFERENCES 1.Thomas S. Basso, “High connected photovoltaic technology codes and standards”, 33rd IEEE Photovoltaic Specialists Conference, 2008, pp. 1-4 VI. This study sought out to answer the question if the design of a microgrid with renewable energy sources is feasible/viable, even in conditions of low energy efficiency and high installation cost (worst case scenarios). This work provides a high-level overview and proposes a method to model the tasks associated with energy, economic and environmental issues. The findings presented in this document are based on a methodology that has simplifications about system design and overall feasibility. Based on the findings, the microgrid of the present study is considered to be feasible (both techno-economically environmentally) and attractive to investment. In this thesis, a multi-string grid-connected photovoltaic (PV) system with harmonic compensation was presented. For the general configuration, a novel topology of central inverter with individual DC/DC converter was introduced to model the grid interface of solar arrays. Then DC transmission lines were also ys. Then DC transmission lines were also Conclusions This study sought out to answer the question if the design of a microgrid with renewable energy sources is feasible/viable, even in conditions of low energy iency and high installation cost (worst case proposed to emulate the short distance between solar arrays and the central inverter. For the distribution network, two segments of distribution lines with phase resistive load were developed to simplify real distribution network. The system performance and transient response under disturbance conditions were analyzed in MATLAB. Later on, small signal analysis was also carried out to validate the simulation model. The results showed that the system remained stable under the disturbance and the performance was level overview and proposes a method to model the tasks associated with energy, economic and environmental issues. The findings presented in this document are based on a hodology that has simplifications about system design and overall feasibility. Based on the findings, the microgrid of the present study is considered to be economically and and environmentally) and attractive to investment. In this connected photovoltaic Thomas S. Basso, “High-penetration, grid- connected photovoltaic technology codes and standards”, 33rd IEEE Photovoltaic Specialists 4 (PV) system with harmonic compensation was presented. For the general configuration, a novel topology of central inverter with individual DC/DC converter was introduced to model the grid interface 2.Yang Weidong, Zhou Xia, Xue Feng, “Impacts of large scale and high voltage level photovoltaic large scale and high voltage level photovoltaic Yang Weidong, Zhou Xia, Xue Feng, “Impacts of @ IJTSRD | Available Online @ www.ijtsrd.com www.ijtsrd.com | Volume – 3 | Issue – 1 | Nov-Dec 2018 Dec 2018 Page: 598
International Journal of Trend in Scientific International Journal of Trend in Scientific Research and Development (IJTSRD) ISSN: 2456 Research and Development (IJTSRD) ISSN: 2456-6470 penetration on the security and stability of power system”, Asia-Pacific Engineering Conference, 2010, pp. 1 Engineering Conference, 2010, pp. 1-5 [3] penetration on the security and stability of power Pacific and grid interfaced photovoltaic system via nine switch three-level inverter”, IECON 2010 Annual Conference on IEEE Industrial Electronics Society, Nov 2010, pp. 3258 Society, Nov 2010, pp. 3258-3262 and grid interfaced photovoltaic system via nine- level inverter”, IECON 2010-36th Annual Conference on IEEE Industrial Electronics Power Power and and Energy Energy 3.H. C. Seo, C. H. Kim, Y. M. Yoon, C. S. Jung, “Dynamics of grid-connected photovoltaic system at fault conditions”, Transmission & Distribution Conference & Exposition, 2009, pp. 1-4 oon, C. S. Jung, 12. Masahide Hojo, Tokuo Ohnishi, “Adjustable harmonic mitigation photovoltaic system utilizing surplus capacity of utility interactive inverter”, 37th IEEE Power Electronics Specialists Conference, 2006, pp. 1 Electronics Specialists Conference, 2006, pp. 1-6 connected photovoltaic system conditions”, Transmission & Distribution Conference & Masahide Hojo, Tokuo Ohnishi, “Adjustable itigation photovoltaic system utilizing surplus capacity of utility interactive inverter”, 37th IEEE Power at fault Asia Asia and and Pacific Pacific for for grid grid-connected 4.S. Phuttapatimok, A. Sangswang, M. Seapan, D. Chenvidhya, and K. Kirtikara, “Evaluat contribution in the presence of PV grid systems”, 33rd IEEE Photovoltaic Specialists Conference, 2008, pp. 1-5 S. Phuttapatimok, A. Sangswang, M. Seapan, D. Chenvidhya, and K. Kirtikara, “Evaluation of fault contribution in the presence of PV grid-connected systems”, 33rd IEEE Photovoltaic Specialists 13.Seyed Hossein Hosseini, Mitra Sarhangzadeh, Mohammad B. B. Sharifian, Farzad sed “Using PV in distribution network to supply local loads and power International Conference on Electrical and Electronics Engineering, 2009, pp. 249 Electronics Engineering, 2009, pp. 249-253 Seyed Hossein Hosseini, Mitra Sarhangzadeh, Mohammad B. B. Sharifian, Farzad sedaghati, “Using PV in distribution network to supply local loads and power International Conference on Electrical and quality quality enhancement”, enhancement”, 5.Prajna Paramita Dash, Mehrdad Kazerani, “Study of islanding behavior of a gridconnected photovoltaic system equipped with a feed control scheme”, 36th Annual Conference on IEEE Industrial Electronics Society, Nov 2010, pp. 3228-3234 Prajna Paramita Dash, Mehrdad Kazerani, “Study of islanding behavior of a gridconnected 14.Xiaogao Chen, Qing Fu, Donghai Wang, “Performance analysis of PV gridconn conditioning system with UPS”, 4 th IEEE Conference on Industrial Applications, 2009, pp. 2172 Applications, 2009, pp. 2172-2176 a feed-forward Xiaogao Chen, Qing Fu, Donghai Wang, “Performance analysis of PV gridconnected power conditioning system with UPS”, 4 th IEEE Conference on Industrial control scheme”, 36th Annual Conference on IEEE Industrial Electronics Society, Nov 2010, Electronics Electronics and and 6.Li Wang, Ying-Hao Lin, “Dynamic stability analyses of a photovoltaic Ito, H. Miyata, analyses of a photovoltaic Ito, H. Miyata, Hao Lin, “Dynamic stability 15.Jing Li, Fang Zhuo, Jinjun Liu, Xianwei Wang, Bo Wen, Lin Wang, Song Ni, “Study on unified control of grid-connected harmonic compensation in dual capacity PV system”, IEEE Energy Conversion Congress and Exposition, 2009, pp. 3336 Congress and Exposition, 2009, pp. 3336-3342 Jing Li, Fang Zhuo, Jinjun Liu, Xianwei Wang, Bo Wen, Lin Wang, Song Ni, “Study on unified connected harmonic compensation in dual-stage high- capacity PV system”, IEEE Energy Conversion 7.M. Taniguchi, T. Aihara, N. Uchiyama, and H. Konishi, “Harmonic current reduction control for grid-connected PV International Power Electronics Conference, 2010, pp. 1695-1700 C. Rodriguez, G. A. J. Amaratunga, “Dynamic connected photovoltaic systems”, IEEE Power Engineering Society General Meeting, June 2004, pp. 2193-2199 M. Taniguchi, T. Aihara, N. Uchiyama, and H. shi, “Harmonic current reduction control for connected PV International Power Electronics Conference, 2010, 1700 C. Rodriguez, G. A. J. Amaratunga, “Dynamic connected photovoltaic systems”, IEEE Power gineering Society General Meeting, June 2004, generation generation and generation generation systems”, systems”, 16.Xiaogao Chen, Qing Fu, David Infield, Shijie Yu, “Modeling and control of Zsource grid PV system with APF func Universities Power Engineering Conference, 2009, pp. 1-5 stability stability of of grid grid- Xiaogao Chen, Qing Fu, David Infield, Shijie Yu, “Modeling and control of Zsource grid-connected PV system with APF function”, 44th International Universities Power Engineering Conference, 8. Li Wang, Tzu-Ching Lin, “Dynamic stability and transient responses of multiple gridconnected PV systems”, IEEE/PES Distribution Conference and Exposition, 2008, pp. 1-6 Ching Lin, “Dynamic stability and transient responses of multiple gridconnected PV systems”, IEEE/PES Distribution Conference and Exposition, 2008, pp. 17.Hongyu Li, Fang Zhuo, Zhaoan Wang, Wanjun Lei, and Longhui Wu, “A novel time current-detection algorithm for shunt active power filters”, IEEE Trans. on Power Systems vol. 20, pp. 644-651 Hongyu Li, Fang Zhuo, Zhaoan Wang, Wanjun Lei, and Longhui Wu, “A novel time-domain detection algorithm for shunt active power filters”, IEEE Trans. on Power Systems, 2005, Transmission Transmission and and 9.Amirnaser Yazdani, Prajna Paramita Dash, “A control methodology and characterization of dynamics for a photovoltaic (PV) system interfaced with a distribution network”, IEEE Trans. on Power Delivery, 2009, vol. 24, pp. 1538-1551 r Yazdani, Prajna Paramita Dash, “A control methodology and characterization of dynamics for a photovoltaic (PV) system interfaced with a distribution network”, IEEE Trans. on Power Delivery, 2009, vol. 24, pp. 18.Gyeong-Hun Kim, Hyo- Jang, Sang-Soo “Performance Analysis of the anti function of a PV-AF system under multiple PV system connections”, International Conference on Electrical Machines and Systems, 2009, pp. 1 achines and Systems, 2009, pp. 1-5 -Rong Seo, Seong-Jae Soo Park, Park, Sang Sang-Yong Kim, “Performance Analysis of the anti-islanding AF system under multiple PV system connections”, International Conference on 10.Chris S. Edrington, Saritha Balatha Jianwu Cao, “Analysis and control of a multi string photovoltaic (PV) system interfaced with a utility grid”, IEEE Power and Energy Society General Meeting, 2010, pp. 1-6 Chris S. Edrington, Saritha Balathandayuthapani, Jianwu Cao, “Analysis and control of a multi- string photovoltaic (PV) system interfaced with a utility grid”, IEEE Power and Energy Society 19.Indranil Bhattacharya, Yuhang Deng, Simon Y. Foo, “Active filters for harmonics elimination in solar photovoltaic grid-connected and stand systems”, 2 nd Asia Symposium on Quality Electronic Design, 2010, pp. 280 Electronic Design, 2010, pp. 280-284 Indranil Bhattacharya, Yuhang Deng, Simon Y. Foo, “Active filters for harmonics elimination in connected and stand-alone systems”, 2 nd Asia Symposium on Quality 11.Chris S. Edrington, Saritha Balathandayuthapani, and Jianwu Cao, “Analysis of integrated storage Chris S. Edrington, Saritha Balathandayuthapani, sis of integrated storage @ IJTSRD | Available Online @ www.ijtsrd.com www.ijtsrd.com | Volume – 3 | Issue – 1 | Nov-Dec 2018 Dec 2018 Page: 599