Download
1 / 6
60 likes | 69 Vues
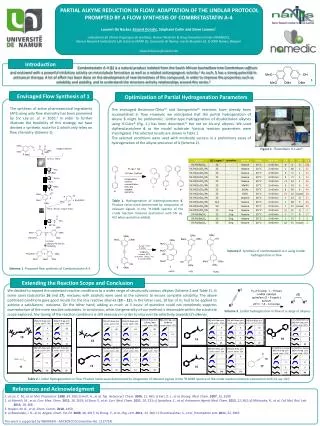
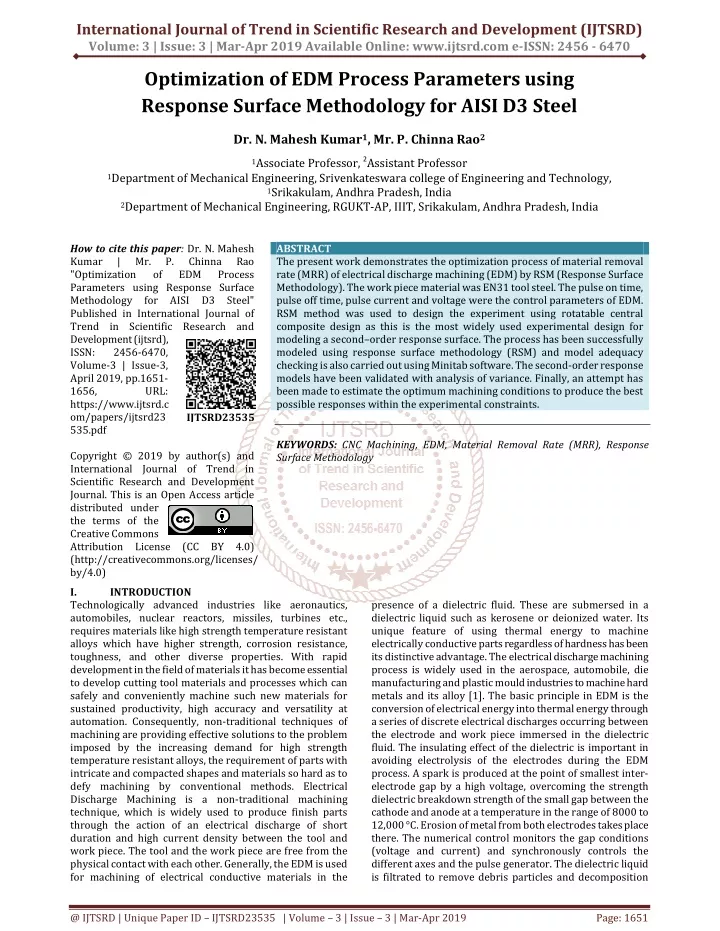
The present work demonstrates the optimization process of material removal rate MRR of electrical discharge machining EDM by RSM Response Surface Methodology . The work piece material was EN31 tool steel. The pulse on time, pulse off time, pulse current and voltage were the control parameters of EDM. RSM method was used to design the experiment using rotatable central composite design as this is the most widely used experimental design for modeling a secondorder response surface. The process has been successfully modeled using response surface methodology RSM and model adequacy checking is also carried out using Minitab software. The second order response models have been validated with analysis of variance. Finally, an attempt has been made to estimate the optimum machining conditions to produce the best possible responses within the experimental constraints. Dr. N. Mahesh Kumar | Mr. P. Chinna Rao "Optimization of EDM Process Parameters using Response Surface Methodology for AISI D3 Steel" Published in International Journal of Trend in Scientific Research and Development (ijtsrd), ISSN: 2456-6470, Volume-3 | Issue-3 , April 2019, URL: https://www.ijtsrd.com/papers/ijtsrd23535.pdf Paper URL: https://www.ijtsrd.com/engineering/mechanical-engineering/23535/optimization-of-edm-process-parameters-using-response-surface-methodology-for-aisi-d3-steel/dr-n-mahesh-kumar<br>

E N D
International Journal of Trend in Scientific Research and Development (IJTSRD) Volume: 3 | Issue: 3 | Mar-Apr 2019 Available Online: www.ijtsrd.com e-ISSN: 2456 - 6470 Optimization of EDM Process Parameters using Response Surface Methodology for AISI D3 Steel Dr. N. Mahesh Kumar1, Mr. P. Chinna Rao2 1Associate Professor,2Assistant Professor 1Department of Mechanical Engineering, Srivenkateswara college of Engineering and Technology, 1Srikakulam, Andhra Pradesh, India 2Department of Mechanical Engineering, RGUKT-AP, IIIT, Srikakulam, Andhra Pradesh, India How to cite this paper:Dr. N. Mahesh Kumar | Mr. P. Chinna Rao "Optimization of EDM Process Parameters using Response Surface Methodology for AISI D3 Steel" Published in International Journal of Trend in Scientific Research and Development (ijtsrd), ISSN: 2456-6470, Volume-3 | Issue-3, April 2019, pp.1651- 1656, URL: https://www.ijtsrd.c om/papers/ijtsrd23 535.pdf Copyright © 2019 by author(s) and International Journal of Trend in Scientific Research and Development Journal. This is an Open Access article distributed under the terms of the Creative Commons Attribution License (CC BY 4.0) (http://creativecommons.org/licenses/ by/4.0) I. INTRODUCTION Technologically advanced industries like aeronautics, automobiles, nuclear reactors, missiles, turbines etc., requires materials like high strength temperature resistant alloys which have higher strength, corrosion resistance, toughness, and other diverse properties. With rapid development in the field of materials it has become essential to develop cutting tool materials and processes which can safely and conveniently machine such new materials for sustained productivity, high accuracy and versatility at automation. Consequently, non-traditional techniques of machining are providing effective solutions to the problem imposed by the increasing demand for high strength temperature resistant alloys, the requirement of parts with intricate and compacted shapes and materials so hard as to defy machining by conventional methods. Electrical Discharge Machining is a non-traditional machining technique, which is widely used to produce finish parts through the action of an electrical discharge of short duration and high current density between the tool and work piece. The tool and the work piece are free from the physical contact with each other. Generally, the EDM is used for machining of electrical conductive materials in the ABSTRACT The present work demonstrates the optimization process of material removal rate (MRR) of electrical discharge machining (EDM) by RSM (Response Surface Methodology). The work piece material was EN31 tool steel. The pulse on time, pulse off time, pulse current and voltage were the control parameters of EDM. RSM method was used to design the experiment using rotatable central composite design as this is the most widely used experimental design for modeling a second–order response surface. The process has been successfully modeled using response surface methodology (RSM) and model adequacy checking is also carried out using Minitab software. The second-order response models have been validated with analysis of variance. Finally, an attempt has been made to estimate the optimum machining conditions to produce the best possible responses within the experimental constraints. KEYWORDS: CNC Machining, EDM, Material Removal Rate (MRR), Response Surface Methodology IJTSRD23535 presence of a dielectric fluid. These are submersed in a dielectric liquid such as kerosene or deionized water. Its unique feature of using thermal energy to machine electrically conductive parts regardless of hardness has been its distinctive advantage. The electrical discharge machining process is widely used in the aerospace, automobile, die manufacturing and plastic mould industries to machine hard metals and its alloy [1]. The basic principle in EDM is the conversion of electrical energy into thermal energy through a series of discrete electrical discharges occurring between the electrode and work piece immersed in the dielectric fluid. The insulating effect of the dielectric is important in avoiding electrolysis of the electrodes during the EDM process. A spark is produced at the point of smallest inter- electrode gap by a high voltage, overcoming the strength dielectric breakdown strength of the small gap between the cathode and anode at a temperature in the range of 8000 to 12,000 °C. Erosion of metal from both electrodes takes place there. The numerical control monitors the gap conditions (voltage and current) and synchronously controls the different axes and the pulse generator. The dielectric liquid is filtrated to remove debris particles and decomposition @ IJTSRD | Unique Paper ID – IJTSRD23535 | Volume – 3 | Issue – 3 | Mar-Apr 2019 Page: 1651
International Journal of Trend in Scientific Research and Development (IJTSRD) @ www.ijtsrd.com eISSN: 2456-6470 products [2].The prediction of optimal machining conditions for good surface finish plays a very important role in process planning. Speeding and Wang [3] have attempted to optimize the process parametric combinations by modeling the process using ANN and characterize the surface in wire electrical discharge machining (WEDM) on AISI 420 through time series techniques. Zhang et al. [4] have investigated the effects on material removal rate, surface roughness and diameter of discharge points in electro-discharge machining (EDM) on ceramics. From the experimental results, they have shown that the material removal rate, surface roughness and the diameter of discharge point all increase with increasing pulse-on time and discharge current. Tsai and Wang [5] have established a semi-empirical model of surface finish on work for various materials (three different grades of steel) in electrical discharge machining and the parameters of the model viz. peak current, pulse duration, electric polarity and properties of materials have been fitted based on the experimental data using Taguchi method. It is seen that the developed model is dependent on work and tool materials. Singh et al. [6] have developed a model for multi-response optimization of process parameters viz. metal removal rate, tool wear rate, taper, radial overcut and surface roughness on electrical discharge machining of Al- 10%SiCp composites. Yih-fong and Fu-chen [7] have presented an approach for optimizing high-speed electrical discharge machining (EDM) using Taguchi methods. They have concluded that the most important factors affecting the EDM process robustness have been identified as pulse-on time, duty cycle, and pulse peak current. Fig. 1 shows Fishbone diagram showing parameters affecting MRR. Figure 1 Fishbone diagram showing parameters affecting MRR II. The design of experiments technique is a very powerful tool, which permits to carry out the modeling and analysis of the influence of process variables on the response variables. Improving the MRR and surface quality are still challenging problem that restrict the expanded application of the technology. Semi-empirical models of MRR for various work piece and tool electrode combinations have been presented by various researchers. The influence of pulse current, pulse time, duty cycle, open circuit voltage and dielectric flushing pressure over the MRR and surface roughness on EN 31 tool steel have also been studied. The optimum processing parameters are very much essential to boost up the production rate to a large extent and shrink the machining time, since these materials, which are processed by EDM are costly and the process is very expensive too. The rotatable central composite design is the most widely used experimental design for modeling a second–order response surface. A design is called rotatable when the variance of the predicted response at any point depends only on the distance of the point from the center point of design. Table I shows the components of central composite second order rotatable design. Table 1 Components of central composite second order Rotatable Design Variable(K) Fractional Point(2k) Start point 2K Center Point Total (N) Value of α 3 8 6 4 16 8 5 16 10 6 32 12 As the number of variables is 4, a total of 31 experiments were planned for this investigation. Experiments were carried out using CNC EDM (EMT 43) Electronica die sinking machine. Table II shows the specification of die sinking EDM machine. Table 2 Specifications of die sinking EDM machine Machining conditions Machine Used CNC EDM (EMT 43) (Electronica) Electrode Electrolytic Copper ( 99.9% Purity) Electrode polarity Positive Workpiece Oil Hardened Non Shrinking Steel ( 48 – 50 RC) Dielectric EDM Oil The composition of AISI D3 steel work-piece material used for experimentation in this work is given in Table 1. EXPERIMENTATION 6 7 6 9 20 31 32 53 1.682 2 2 2.378 @ IJTSRD | Unique Paper ID - IJTSRD23535 | Volume – 3 | Issue – 3 | Mar-Apr 2019 Page: 1652
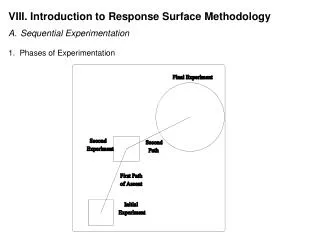
International Journal of Trend in Scientific Research and Development (IJTSRD) @ www.ijtsrd.com eISSN: 2456-6470 Table 3 Chemical composition of AISI D3 steel (wt %) Material C Cr Mn AISI D3 2.05 11.10 0.589 0.042 0.055 0.498 0.065 Mo V Si Ni An electrolytic pure copper with 25 mm X 25 mm is used as a tool electrode (positive polarity).The machining parameters and their levels are shown in Table 4. Table 4 Different variables used in the experiment and their levels Level 2 300 Variable coding 1 3 Pulse On (Ton) in μs Pulse Off (Toff) in ìs Discharge Current (Ip) in A Voltage (V) in V A B C D 200 1800 1700 1600 8 12 40 60 400 16 80 The parameter MRR is selected as response variable, which refers to the machining efficiency of the EDM process and defined as follows: MRR (gm/min) = : Where, Wi = Initial weight of work piece material (gms), Wf= Final weight of work piece material (gms),t = Time period of trials in minutes The work piece is weighed before and after each experiment using an electric balance to determine the value of MRR. For efficient evolution of the EDM process, the larger MRR is regarded as the best machining performance. III. METHODOLOGY In statistics, Response surface methodology (RSM) investigates the interaction between several illustrative variables and one or more response variables. Box and Draper [9] were introducing RSM in 1951.The most important purpose of RSM is to use a series of designed experiments to attain an optimal response. A second-degree polynomial model is use in RSM. These models are only an approximation, but used because such a model is easy to estimate and apply, even when little is known about the process. The process of RSM includes designing of a series of experiments for sufficient and reliable measurement of the response and developing a mathematical model of the second order response surface with the best fittings. Obtaining the optimal set of experimental parameters, thus produce a maximum or minimum value of the response. The Minitab Software was used to analyze the data [10] IV. RESULT AND DISCUSSION Using the experimental results for MRR (Table IV), response surface model is developed and analysis of variance (ANOVA) for the adequacy of the model is then performed in the subsequent step. The F ratio is calculated for 95% level of confidence. Table 5 ANOVA table for MRR (before elimination) Estimated Regression Coefficients for MRR Term Coefficient SE Coefficient Constant 0.22752 0.00508 A 0.000681 0.002744 B 0.053207 0.002744 C 0.096158 0.002744 D -0.0431 0.002744 A*A -0.00201 0.002513 B*B -0.00335 0.002513 C*C 0.012858 0.002513 D*D 0.01777 0.002513 A*B -0.00214 0.00336 A*C 0.00251 0.00336 A*D 0.000303 0.00336 B*C 0.021314 0.00336 B*D -0.013 0.00336 C*D -0.01826 0.00336 S = 0.0134406 PRESS = 0.0166486 R-Sq = 99.21% R-Sq(pred) = 95.46% R-Sq(adj) = 98.52% After eliminating the non-significant terms, the final response equation for MRR is given as follows: MRR = 0.222579 + ( 0.000681 X Ton ) + (0.053207 X Toff )+( 0.096158 X Ip )- (0.043101 X V ) + (0.013372 X Ton2 ) +(0.018285 X V2 )+ (0.021314 X Toff X Ip )- (0.012999 X Toff )- (0.018288 X Ip X V) The final model is tested for variance analysis (F-test) and indicates that the adequacy of the test is established which are justified with F-values. For the analysis the data, the checking of goodness of fit of the model is very much required. The model adequacy checking includes the test for significance of the regression model, test for significance on model coefficients, and test for lack of fit. For this purpose, analysis of variance (ANOVA) is performed. Table V shows the ANOVA for the response, MRR. The fit summary recommends that the quadratic model is statistically significant for analysis of MRR. T p 0 44.787 0.248 19.393 35.049 -15.71 -0.799 -1.331 5.116 7.07 -0.636 0.747 0.09 6.343 -3.868 -5.433 0.807 0 0 0 0.436 0.202 0 0 0.534 0.466 0.929 0 0.001 0 @ IJTSRD | Unique Paper ID - IJTSRD23535 | Volume – 3 | Issue – 3 | Mar-Apr 2019 Page: 1653
International Journal of Trend in Scientific Research and Development (IJTSRD) @ www.ijtsrd.com eISSN: 2456-6470 Table 6 Analysis of Variance for MRR DF Seq. SS 9 0.363588 0.363588 0.040399 244.87 0 4 0.334449 0.334449 0.083612 2 0.013834 0.013834 0.006917 3 0.015304 0.015304 0.005101 21 0.003465 0.003465 0.000165 15 0.003465 0.003465 0.000231 6 0 0 30 0.367052 Source Regression Linear Square Interaction Residual Error Lack-of-Fit Pure Error Total Adj. SS Adj. MS F P 506.8 41.93 30.92 0 0 0 0 The normal probability plot of residuals for MRR is illustrated in Fig 2.It is expected that data from experiments form a normal distribution. It reveals that the residual fall on a straight line, implying that the errors are spread in a normal distribution. Here a residual means difference in the observed value (obtained from the experiment) and the predicted value or fitted value. This is also, confirmed by the variations between the experimental results and model predicted values analyzed through residual graphs, and are presented in Fig 3. Figure 2 Normal Probability Figure 3 Residual Plot Figure4. Main Effects Plot From this main effects plot , Figure 4 it is clear that the parameters pulse off and current have highest inclination, so these are most significant but pulse on and voltage are nearly horizontal, so these are non- significant. The parametric analysis has been carried out to study the influences of the input process parameter such as Ton, Toff, Ip and V on the process response, MRR during die-sinking EDM process. Contour plots and three-dimensional response surface plots are formed based on the quadratic model to evaluate the variation of response. The plots are shown in Figures 5-10.These plots can also give further assessment of the correlation between the process parameters and response as under: 1.MRR increases with increase in Ip and Ton. This is due to higher spark energy from high temperature. (Figure 2. MRR decreases with increase in Toff. 2.Increase in applied voltage also increase MRR. Figure6. Variation of MRR according to change of Hold value: Ton=300(µs), V =60 Figure5. Variation of MRR according to change of Ip and Ton Hold value: Toff =1700(µs), V= 60 @ IJTSRD | Unique Paper ID - IJTSRD23535 | Volume – 3 | Issue – 3 | Mar-Apr 2019 Page: 1654
International Journal of Trend in Scientific Research and Development (IJTSRD) @ www.ijtsrd.com eISSN: 2456-6470 Fig7.Variation of MRR according to change of voltage and current and Hold on Values: Ton=300(μs), Toff= 1700(μs) Fig9. Variation of MRR according to change of Toff Ip= 12A Ton=300(ìs) voltage Fig8. Variation of MRR change of voltage Hold value: Ip= 12A, Toff=1700(μs) Fig 10.Variation of MRR according to change of Hold value: Toff and Hold value: V=60, Ip= 12A To check the developed model one confirmation test is carried out at the mid-levels of the process parameters. Table 5and 6 shows the result of the confirmation run for MRR. It is observed that the calculated error is small (about 2%) This confirms the reproducibility of experimental conclusion. Table 7Conformation test result and comparison with predicted result as per model MRR(gm/min) Ton (μs) Toff (ìs) Ip (A) V (Volt) Experimental Model Predicted error (%) 300 1700 12 60 0.22752 0.222579 2.17 Finally an optimum condition is obtained from RSM with an objective of maximum MRR within the experimental range and the levels of the process parameters are Pulse on 500 μs, Pulse off 1500 μs, Current 20 A and Voltage 60 V. V. CONCLUSION Experimental investigation on electrical discharge machining of EN 31 tool steel is performed with a view to correlate the process parameters with the responses for MRR. The process has been successfully modeled using response surface methodology (RSM) and model adequacy checking is also carried out. The second-order response models have been validated with analysis of variance. Finally, an attempt has been made to estimate the optimum machining conditions to produce the best possible response within the experimental constraints. This study can help researchers and industries for developing a robust, reliable knowledge base and early prediction of MRR without experimenting with EDM process for EN 31 tool steel. REFERENCES [1].Marafona J. D., Jo A. A. (2009), “Influence of work piece hardness on EDM performance”, International Journal of Machine Tools & Manufacture, Vol. 49, pp. 744–748. [2].Kunieda M., Lauwers B., Rajurkar K. P., Schumacher B. M. (2005), “Advancing EDM through Fundamental Insight into the Process”, Journal of Materials Processing Technology, Annals of CIRP, Vol. 54(2), pp. 599-622. [3].Spedding, T.A. and Wang, Z. Q., (1997), “Parametric optimization and surface characterization of wire electrical discharge machining process”, Precision Engineering, Vol. 20, pp.5-15. @ IJTSRD | Unique Paper ID - IJTSRD23535 | Volume – 3 | Issue – 3 | Mar-Apr 2019 Page: 1655
International Journal of Trend in Scientific Research and Development (IJTSRD) @ www.ijtsrd.com eISSN: 2456-6470 [4].Zhang, J.H., Lee, T.C. and Lau, W.S., (1997), “Study on the electro-discharge machining of a hot pressed aluminum oxide based ceramic”, Journal of Materials Processing Technology, Vol. 63, pp.908-912. [7].Yih-fong, T. and Fu-chen, C., (2003), “A simple approach for robust design of high-speed electrical discharge. Machining technology”, International Journal of Machine Tools and Manufacture, Vol. 43, pp.217–227. [5].Tsai, K.M. and Wang, P.J., (2001), “Predictions on surface finish in electrical discharge machining based upon neural network models”, International Journal of Machine Tools and Manufacture, Vol. 41, pp.1385– 1403. [8].Cochran, G., and Cox, G.M. (1962), “Experimental design”, Asia Publishing House, New Delhi. [9].Box, G. E. P. and N.R. Draper, 1987. “Empirical Model- Building and Response Surfaces,” Jon Wiley & Sons, New York. [6].Singh, P. N., Raghukandan, K. and Pai, B.C., (2004), “Optimization by Grey relational analysis of EDM parameters on machining Al-10%SiCp composites”, Journal of Materials Processing Technology, Vol.155– 156, pp.1658–1661. [10].Minitab14 (2003). Minitab User Manual Release 14. State College, PA, USA. @ IJTSRD | Unique Paper ID - IJTSRD23535 | Volume – 3 | Issue – 3 | Mar-Apr 2019 Page: 1656