Download
1 / 5
50 likes | 58 Vues
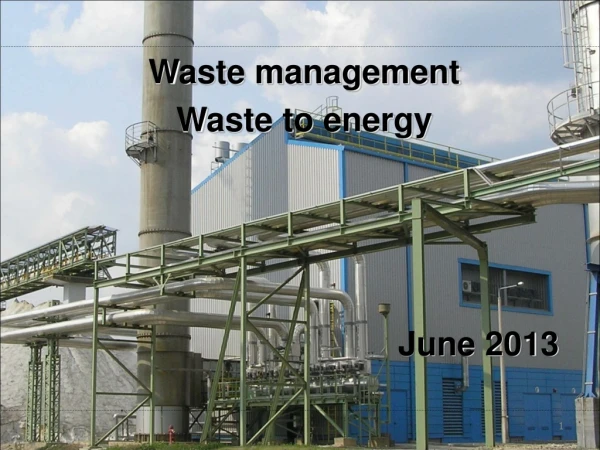
Waste management is a complex topic that is handled in different ways around the world based on available local resources, technologies, and intensity of community initiatives. So, Waste to Energy WTE is a renewable energy technology that has seen a major rise in the last decade as Myanmar has been looking for methods for handling its population boom and related rapid increase in waste generation rates. The conventional fuels required for production of electricity is decreasing day by day and it is very important to find out alternative sources which can be used as the fuel for the production of electricity especially for developing countries like Myanmar. In this paper, feasibility study of waste to energy WTE power conversion plant is presented to fulfil the main aim of zero waste city implementation, Mandalay, Myanmar. With the application of WTE plants, the electricity requirement can be fulfilled and also helpful for environmental condition. For case study, Mandalay Industrial Zone is selected since it has low reliability of power supply form national grid and is suitable for construction of a WTE power plant. The simulation for WTE power plant with a peak load of 30 MW is described using HOMER software. Average energy consumption of the industrial zone is estimated approximately 283 MWh day and WTE has consumed almost 118,935 tonne per year of municipal solid waste MSW . The proposed system is designed to provide approximately 100 of energy from the municipal solid waste for the proposed area. Phyu Phyu Win | Thida Win | Zin Mar "Zero-Waste City Implementation using Waste-To-Energy Technology in Myanmar" Published in International Journal of Trend in Scientific Research and Development (ijtsrd), ISSN: 2456-6470, Volume-3 | Issue-5 , August 2019, URL: https://www.ijtsrd.com/papers/ijtsrd28012.pdf Paper URL: https://www.ijtsrd.com/humanities-and-the-arts/environmental-science/28012/zero-waste-city-implementation-using-waste-to-energy-technology-in-myanmar/phyu-phyu-win<br>

E N D
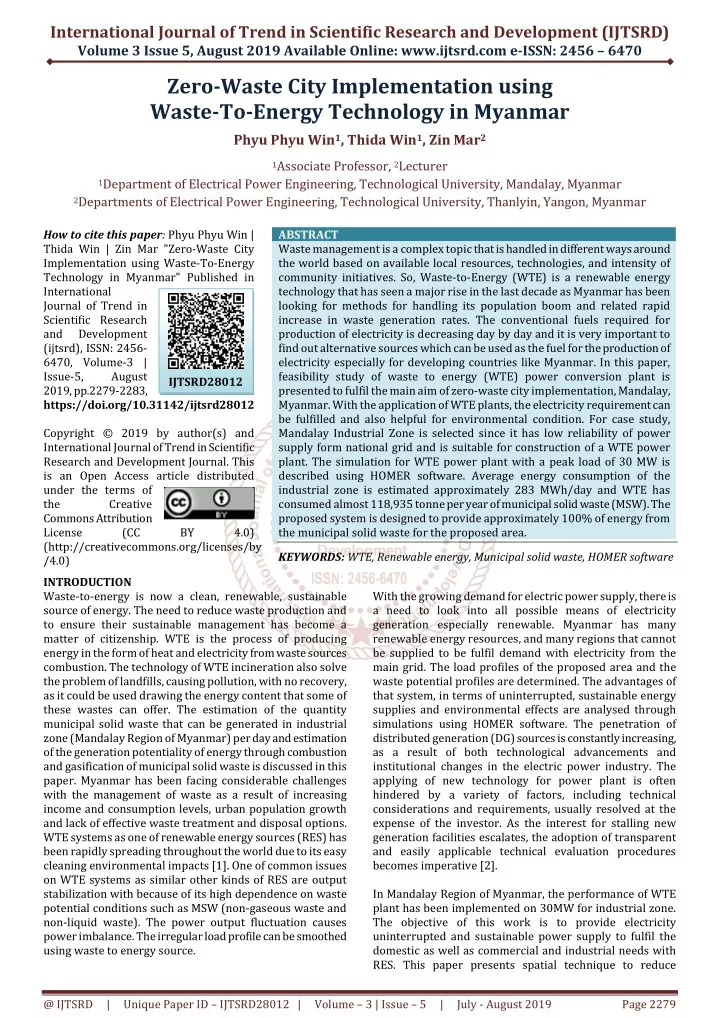
International Journal of Trend in Scientific Research and Development (IJTSRD) Volume 3 Issue 5, August 2019 Available Online: www.ijtsrd.com e-ISSN: 2456 – 6470 Zero-Waste City Implementation using Waste-To-Energy Technology in Myanmar Phyu Phyu Win1, Thida Win1, Zin Mar2 1Associate Professor, 2Lecturer 1Department of Electrical Power Engineering, Technological University, Mandalay, Myanmar 2Departments of Electrical Power Engineering, Technological University, Thanlyin, Yangon, Myanmar How to cite this paper: Phyu Phyu Win | Thida Win | Zin Mar "Zero-Waste City Implementation using Waste-To-Energy Technology in Myanmar" Published in International Journal of Trend in Scientific Research and Development (ijtsrd), ISSN: 2456- 6470, Volume-3 | Issue-5, August 2019, pp.2279-2283, https://doi.org/10.31142/ijtsrd28012 Copyright © 2019 by author(s) and International Journal of Trend in Scientific Research and Development Journal. This is an Open Access article distributed under the terms of the Creative Commons Attribution License (CC (http://creativecommons.org/licenses/by /4.0) INTRODUCTION Waste-to-energy is now a clean, renewable, sustainable source of energy. The need to reduce waste production and to ensure their sustainable management has become a matter of citizenship. WTE is the process of producing energy in the form of heat and electricity from waste sources combustion. The technology of WTE incineration also solve the problem of landfills, causing pollution, with no recovery, as it could be used drawing the energy content that some of these wastes can offer. The estimation of the quantity municipal solid waste that can be generated in industrial zone (Mandalay Region of Myanmar) per day and estimation of the generation potentiality of energy through combustion and gasification of municipal solid waste is discussed in this paper. Myanmar has been facing considerable challenges with the management of waste as a result of increasing income and consumption levels, urban population growth and lack of effective waste treatment and disposal options. WTE systems as one of renewable energy sources (RES) has been rapidly spreading throughout the world due to its easy cleaning environmental impacts [1]. One of common issues on WTE systems as similar other kinds of RES are output stabilization with because of its high dependence on waste potential conditions such as MSW (non-gaseous waste and non-liquid waste). The power output fluctuation causes power imbalance. The irregular load profile can be smoothed using waste to energy source. ABSTRACT Waste management is a complex topic that is handled in different ways around the world based on available local resources, technologies, and intensity of community initiatives. So, Waste-to-Energy (WTE) is a renewable energy technology that has seen a major rise in the last decade as Myanmar has been looking for methods for handling its population boom and related rapid increase in waste generation rates. The conventional fuels required for production of electricity is decreasing day by day and it is very important to find out alternative sources which can be used as the fuel for the production of electricity especially for developing countries like Myanmar. In this paper, feasibility study of waste to energy (WTE) power conversion plant is presented to fulfil the main aim of zero-waste city implementation, Mandalay, Myanmar. With the application of WTE plants, the electricity requirement can be fulfilled and also helpful for environmental condition. For case study, Mandalay Industrial Zone is selected since it has low reliability of power supply form national grid and is suitable for construction of a WTE power plant. The simulation for WTE power plant with a peak load of 30 MW is described using HOMER software. Average energy consumption of the industrial zone is estimated approximately 283 MWh/day and WTE has consumed almost 118,935 tonne per year of municipal solid waste (MSW). The proposed system is designed to provide approximately 100% of energy from the municipal solid waste for the proposed area. KEYWORDS: WTE, Renewable energy, Municipal solid waste, HOMER software With the growing demand for electric power supply, there is a need to look into all possible means of electricity generation especially renewable. Myanmar has many renewable energy resources, and many regions that cannot be supplied to be fulfil demand with electricity from the main grid. The load profiles of the proposed area and the waste potential profiles are determined. The advantages of that system, in terms of uninterrupted, sustainable energy supplies and environmental effects are analysed through simulations using HOMER software. The penetration of distributed generation (DG) sources is constantly increasing, as a result of both technological advancements and institutional changes in the electric power industry. The applying of new technology for power plant is often hindered by a variety of factors, including technical considerations and requirements, usually resolved at the expense of the investor. As the interest for stalling new generation facilities escalates, the adoption of transparent and easily applicable technical evaluation procedures becomes imperative [2]. In Mandalay Region of Myanmar, the performance of WTE plant has been implemented on 30MW for industrial zone. The objective of this work is to provide electricity uninterrupted and sustainable power supply to fulfil the domestic as well as commercial and industrial needs with RES. This paper presents spatial technique to reduce IJTSRD28012 BY 4.0) @ IJTSRD | Unique Paper ID – IJTSRD28012 | Volume – 3 | Issue – 5 | July - August 2019 Page 2279
International Journal of Trend in Scientific Research and Development (IJTSRD) @ www.ijtsrd.com eISSN: 2456-6470 environmental impacts waste. It is intended to solve the waste problems and to present the distributed generation system. For the case study, Mandalay industrial zonen (IZ), Mandalay, Myanmar, is selected. The power demand of the distribution system and the available municipal solid waste are formerly observed. Then the available power from waste is calculated. Then the generated power from WTE plant using synchronous generator is supplied for proposed area. WTE Technologies Geothermal and WTE systems emit someair pollutants, though total air emissions are generally much lower than those of coal- and natural gas-fired power plants. WTE and geothermal power plants, like coal- and natural gas-fired power plants, may require water for cooling. Hydroelectric power plants can disrupt river ecosystems both upstream and downstream from the dam. However, renewable energy study, which included WTE system found that effects environmental pollution can be reduced and withdrawal would be increased significantly in a future with high using of renewable. There are four main technologies which are used in WTE plants, three are thermal (combustion, gasification and pyrolysis) and one is biological (anaerobic digestion). For reasons which are not at all obvious, as all four technologies have been in widespread use for many decades, the Government has decided that ‘gasification’, ‘pyrolysis’ and ‘digestion’ are Advanced Conversion Technologies (ACTs), while ‘combustion’ is not. Wastes that can be used in combustion processes includes MSW, RDF (refuse derived fuel), bulky waste, product specific industrial waste, packaging waste, hazardous waste, sewage sludge, clinical waste, waste cooking oil, waste lubrication oil, straw, and combustible fraction from fragmentation of metal scrap SLF(shredder light fraction) [3]. The system block diagram shown three options of WTE generation is illustrated in Figure 1. In this paper, the stand alone WTE power plant using gas engine is presented for proposed area. Fig. 2 Municipal Solid Waste in Mandalay The major sources of MSW generation of IZ are Organic (77%), Plastic (13%), Paper (7%), and others (3%) of waste type. Based on survey data, the available waste from Mandalay is described in Table I. The southern part of Mandalay (Thaung Inn Myout Inn) generates, on an average, about 560 tons of MSW per day [5] and WTE plant use only the wastes from Thaung Inn Myout Inn. Table1. Waste Generation Amount of Mandalay District Northern part of Mandalay ( Kyar Ni Kan) Southern part of Mandalay ( Thaung Inn Myout Inn) Total B.Waste Disposal Methods Waste can be handled in many ways by a given community. In general, waste management experts and professionals adhere to a waste management hierarchy that presents best practices in the field of waste management. This hierarchy, shown in Fig. 3, prioritizes the reduction and reuse of waste where possible. Where waste is unavoidable, it should be recycled or composted to give the material new value. When recycling and composting are not viable solutions, responsible energy recovery methods, such as WTE, should be used. Lastly, the leftovers that have no better treatment solution are discarded into landfills. Tons of waste per day 400 560 960 Fig.1 System Block Diagram for WTE Power Plant Waste Management In the waste to energy (WTE) electricity generation, the power can be obtained from dry solid waste directly or from wet solid waste via gasification. A.Waste Generation Rates In this paper presents about MSW which comprises dry solid waste (DSW) and wet solid waste (WSW). Both of them can generate electricity but their efficiencies differ depending on their components. The component percentage of DSW and WSW are 30% and 70% [4]. Myanmar’s municipal solid waste is generated from household (60%), markets (15%), commercial (10%), hotel(2%), garden(5%), and others(8%) and is shown in Fig. 2. Fig. 2 Waste Disposal Hierarchy Design Management In this paper, WTE stand alone system is presented to supply the proposed area. A.Demand Side Management The proposed area is the industrial zone which is located at 21.89 (N) latitude and 96.09 (E) longitudes in Mandalay region in Myanmar. From consumption of load profile for load component, the daily and monthly load profiles for industrial zone are shown in Fig. 3 and Fig. 4, respectively [6]. @ IJTSRD | Unique Paper ID – IJTSRD28012 | Volume – 3 | Issue – 5 | July - August 2019 Page 2280
International Journal of Trend in Scientific Research and Development (IJTSRD) @ www.ijtsrd.com eISSN: 2456-6470 2.WTE Gasifier and Synchronous Generator A gasification plant includes the gasifier reactor as well as support equipment. The design of a gasification plant would involve design of individual units: Gasifier reactor Waste-handling system Waste-feeding system Gas-cleanup system Ash or solid residue-removal system The movement of biomass down the gasifier is shown in Fig. 6, including a description of the temperature gradient during the gasification process. Daily Load Curve in Peak 20 17.5 15 Power(MW) 10 9.1 5 0 1 2 3 4 5 6 7 8 9 101112131415161718192021222324 Time(hr) Fig. 3 Daily Load Profile for Industrial Zone Figure 3 shows daily load profile for Industrial Zone. The maximum load is 17.5 MW at 10 am and the minimum load is 9.1 MW at 4 am. According to the calculation, the average power demand over a day is about 11.9 MW. Due to the presence of industries, the power demand is high between 7:00 a.m and 4:00 p.m. Monthly Profile of Maximum Power Consumption 20 Fig. 6 Schematic of the Operation of a Throatless Downdraft Gasifier (left) and Temperature Gradient along the Height (right) The technical and economical parameters of the biogas generator are listed in Table II. TABLE 2 Technical and Economic Parameters of the Biogas Generator Set Parameter Size Capital cost Bio gasifier and generator set (incl. transport cost) Replacement cost Operation and maintenance cost Minimum load ratio Lifetime (operating hours) Rated volage Rated Frequency Rated speed THEROTICAL BACKGROUND FOR EVALUATION The performance of the renewable system can be analyzed based on the goals of cost minimization, system reliability improvement, and reduction of greenhouse gas emissions [7]. The net present cost is calculated by discounting the annual, quarterly, and monthly financial flows [8]. The net present cost of a system is the present value of all costs minus all values over its lifetime, and it includes capital costs, replacement costs, operation and maintenance costs, and fuel costs. The levelized cost of energy is calculated by dividing the total life-cycle cost by the total energy output during the project lifetime [8]. The mathematical equations are formulated for the simulations using the HOMER, as follows [8], [9], [10]. C C CRF i n i f i f Power (MW) 10 o May Mar Aug Apr Nov Feb Dec Jun Oct Jan Sep Jul Month Fig. 4 Monthly Load Profile for Industrial Zone Figure 4 shows the monthly load profile for industrial zone. These values are the average values over the corresponding month. As monthly average, the maximum demand is observed at April with 17.8 MW and minimum demand is observed at December with 14.3 MW. The demand is large during rainy season and summer. In winter (during November to February), the demand decreases as shown in Fig. 4. B.Supply Side Management For supply side management, WTE power plant using gasification technology is presented to fulfill the demand side requirements. 1.Waste Potential Mandalay industrial zone has availability to use wast for power production throughout the year Southern part of Mandalay ( Thaung Inn Myout Inn). The selected value of gasification ratio is 0.7 (kg gas/kg biomass). The LHV of biogas is 5.5 MJ/kg. The average price of waste incentive is $7/ton. The waste potential for proposed area is shown in Fig. 5. Biomass Resource Value 30 Units MW 75 × 106 $ 60 × 106 0.03 30 30000 400/230 50/60 1500 $ $/hr % hours V Hz rpm 600 Available Biomass (t/d) 500 400 300 (1) 200 anntot NPC ( , ) 100 0 Jan Feb Mar Apr May Jun Jul Aug Sep Oct Nov Dec Fig. 5 Monthly Biomass Resource Profile for Proposed Area (2) nom 1 @ IJTSRD | Unique Paper ID – IJTSRD28012 | Volume – 3 | Issue – 5 | July - August 2019 Page 2281
International Journal of Trend in Scientific Research and Development (IJTSRD) @ www.ijtsrd.com eISSN: 2456-6470 r S C : annual discount rate (%) : salvage value ($) : replacement cost of the component ($) TLCC Q n (3) LCOE N ( ) r n (1 ) rep n 1 : remaining life of the component (yrs) : lifetime of the component (yrs) L L rem N C n ( ) r (4) TLCC n comp es f E E SIMULATION RESULTS In the simulations, the parameters presented in table 2 and the equations (1) to (7) presented in above section are used to show the simulation results. A.Economic Results For WTE system, 60 MW WTE gasifier-generator set is used for supplying the proposed area. The simulation results for the net present cost and nominal cash flow are shown in Figs. 7 and 8 respectively. The generations from the WTE is fulfilling the 100% of total power consumption. Cash Flow Summary (1 ) n 1 : capacity shortage fraction : total capacity shortage (kWh/yr) : total electric (kWh/yr) L (5) rem S C sc rep comp L tot E E (6) sc f es tot n i (1 i ) (7) CRF i n ( , ) n i (1 i ) 1 The parameters in (1)−(7) are de?ined as follows. C : net present cost ($) C : total annualized cost ($/yr) ( , ) CRF i n : capital recovery factor i : annual real interest rate (%) i : nominal interest rate (%) f : annual inflation rate (%) n : index for the year N : project duration (yrs) LCOE : levelized cost of energy ($/kWh) TLCC : total life cycle cost ($) ( ) Q n : energy output of power generation system in the specific year of n (kW) ( ) C n : total cost in the specific year of n ($) NPC anntot 120,000,000 Capital Replacement Operating Fuel Salvage nom 100,000,000 80,000,000 Net Present Cost ($) 60,000,000 40,000,000 20,000,000 0 -20,000,000 Capital Replacement Operating Fuel Salvage Capital ($) 75,000,000 75,000,000 Replacement ($) 109,246,320 109,246,320 O&M ($) Fuel ($) Salvage ($) Total ($) Component WTE System 57,776,408 6,102,537 -1,982,992 246,142,272 57,776,408 6,102,537 -1,982,992 246,142,272 Fig. 7 Net Present Cost TABLE 3 ELECTRICAL RESULTS FROM WTE Quantity Excess electricity Cost of energy Unmet load Capacity shortage Renewable fraction Hours of operation Number of starts Operational life Capacity factor Electrical production Mean electrical output Min. electrical output Max. electrical output Bio. Feedstock consump. Specific fuel consumption Fuel energy input Mean electrical efficiency C. Environmental Results The simulation results for environmental impacts in term of the emissions of CO2, CO and NO are shown in table 4. Value 3.58 0.325 0.01 0.02 1.000 8,758 2 3.43 40.8 107,303,752 12,252 9,000 29,790 118,935 0.776 127,194,264 84.4 Units % $/kWh % % hr/yr starts/yr yr % kWh/yr kW kW kW t/yr kg/kWh kWh/yr % Fig.8 Nominal Cash Flow for Case Study I B.Electrical Results The monthly average generation for WTE is illustrated in Fig. 9 and the electrical results for WTE are described in table3. Production (kWh/yr) 107,303,752 107,303,752 Fraction Component WTE Total 100% 100% Fig. 9 Monthly Average Generation of WTE @ IJTSRD | Unique Paper ID – IJTSRD28012 | Volume – 3 | Issue – 5 | July - August 2019 Page 2282
International Journal of Trend in Scientific Research and Development (IJTSRD) @ www.ijtsrd.com eISSN: 2456-6470 TABLE 4 ENVIRONMENTAL RESULTS Pollutant Carbon dioxide Carbon monoxide Unburned hydocarbons Particulate matter Sulfur dioxide Nitrogen oxides Scientific Innovation (IJSI), Volume III, Issue VIII, pp 82-84, 2016. Emissions (kg/yr) 20,574 773 85.6 58.3 0 6,898 [2]National Renewable Energy Laboratory (NREL) “Renewable Electricity Futures Study”, Volume I, pp . 210, 2012 [3]Hafezur Rahman, Md Rayhan Sharif, “Designing of Biomass Based Power Plant for Residential Building Energy System”, 2nd Int'l Conf. on Electrical Engineering and Information & Communication Technology (ICEEICT) Jahangirnagar University, Bangladesh, 2015. CONCLUSION Distributed generation model of WTE system has been proposed in this paper. To simulate the proposed model, the simulation has been done for the WTE system using real resource data and load demand. Myanmar, being a country that has many renewable energy sources and non-electrified rural villages, was found to be suitable for the implementation of renewable systems. Thus, in this paper, the industrial zone in Myanmar is selected and supplied from the stand alone system with economic feasibility, considering the specific local conditions and resource availability for that area. The evaluation results in this paper suggest that government and private sector organizations in Myanmar should consider the WTE system as a highly suitable alternative, when implementation of zero-waste city for Mandalay. ACKNOWLEDGMENT The author would like to thank to her all friends form department of Electrical Power Engineering, Technological University (Mandalay), for their helpful advices to submit on IJTSRD Journal. The author would like to express grateful thanks to my friend, Dr. Zin Mar, Lecturer, Department of Electrical Power Engineering, Technological University (Thanlyin) for her effective support and encouragement. REFERENCES [1]Shubham Gupta*, Prof. R. S. Mishra#, “Estimation of Electrical Energy Generation from Anaerobic Digestion Technology’’, International Journal of Research and [4]Ranade PowerGeneration from Solid Waste Generated in Sub- urban Area Using Spatial Techniques”, A Case Study for Pune City, India, International Journal of Geomatics and Geosciences, Volume 2, 2011. Pinak, BPt Geeta, “Estimation of [5]Mandalay City Department Committee (MCDC), Enviornmental Conservation “Waste Management Strategy and Action Plan For Mandalay City, 2017. Department(ECD), [6]Su Wutyi Kyaw and Kyaw San Lwin, ''Design and Simulation of Grid Integrated Waste to Energy Power Supply for Industrial Zone", 21 June, 2019. [7]Tom Lambert, Homer - Hybrid Optimization Model for Electric Renewable, U.S. National Renewable Energy Laboratory, Apr. 2008. [8]H. Rezzouk and A. Mellit, “Feasibility Study and Sensitivity Analysis of a Stand-alone Photovoltaic- diesel-battery Hybrid Energy System in the North of Algeria,” Renew. Sustain. Energy Rev., vol. 43, pp.1134- 1150, Mar. 2015. [9]Serm Janjai et al., Assessment of Solar Energy Potentials for the Union of Myanmar, Department of Alternative Energy Developmen and Efficiency, Sep. 2009. [10]Sandia National Laboratories, Stand-Alone Photovoltaic Systems−A Handbook of Recommended Design Practices, U.S. Department of Energy, 1995. @ IJTSRD | Unique Paper ID – IJTSRD28012 | Volume – 3 | Issue – 5 | July - August 2019 Page 2283