Download

1 / 3
30 likes | 32 Vues
SPSS is powerful to analyze data clustering and forecasting. This paper intends to support people who are interesting the species of flowers the benefits of data forecasting with applied SPSS. It showed the species value forecasting based on sepal length and sepal width. As SPSS's background algorithms, it showed the KNN algorithm for data clustering and data forecasting. It includes one sample data was downloaded from Google and was analyzed and viewed. It used IBM SPSS statistics version 23 and PYTHON version 3.7 Aung Cho | Aung Si Thu | Aye Mon Win "Applied SPSS for Data Forecasting of Flowers Species Name" Published in International Journal of Trend in Scientific Research and Development (ijtsrd), ISSN: 2456-6470, Volume-3 | Issue-5 , August 2019, URL: https://www.ijtsrd.com/papers/ijtsrd26665.pdf Paper URL: https://www.ijtsrd.com/computer-science/data-miining/26665/applied-spss-for-data-forecasting-of-flowers-species-name/aung-cho<br>

E N D
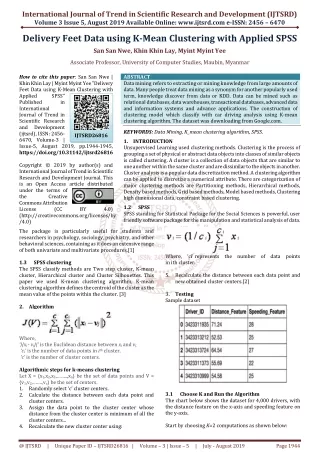
International Journal of Trend in Scientific Research and Development (IJTSRD) Volume 3 Issue 5, August 2019 Available Online: www.ijtsrd.com e-ISSN: 2456 – 6470 Applied SPSS for Data Forecasting of Flowers Species Name Aung Cho1, Aung Si Thu2, Aye Mon Win3 1,2University of Computer Studies, Maubin,Myanmar 3University of Computer Studies, Hinthata, Myanmar How to cite this paper: Aung Cho | Aung Si Thu | Aye Mon Win "Applied SPSS for Data Forecasting of Flowers Species Name" Published in International Journal of Trend in Scientific Research and Development (ijtsrd), ISSN: 2456- 6470, Volume-3 | Issue-5, August 2019, https://doi.org/10.31142/ijtsrd26665 Copyright © 2019 by author(s) and International Journal of Trend in Scientific Research and Development Journal. This is an Open Access article distributed under the terms of the Creative Commons Attribution License (CC (http://creativecommons.org/licenses/by /4.0) The text is not intended in any way to be an introduction to statistics and, indeed, we assume that most readers will have attended at least one statistics course and will be relatively familiar with concepts such as linear regression, correlation, significance tests, and simple analysis of variance. Our hope is that researchers and students with such a background will find this book a relatively self-contained means of using SPSS to analyze their data correctly.[2] 1.2 KNN Algorithm [1] Nearest Neighbor Analysis is a method for classifying cases based on their similarity to other cases. In machine learning, it was developed as a way to recognize patterns of data without requiring an exact match to any stored patterns, or cases. Similar cases are near each other and dissimilar cases are distant from each other. Thus, the distance between two cases is a measure of their dissimilarity. Cases that are near each other are said to be “neighbors.” When a new case (holdout) is presented, its distance from each of the cases in the model is computed. The classifications of the most similar cases – the nearest neighbors – are tallied and the new case is placed into the category that contains the greatest number of nearest neighbors. You can specify the number of nearest neighbors to examine; this value is called k. The pictures show how a new case would be classified using two different values of k. When k = 5, the new case is placed in category 1 because a majority of the nearest neighbors belong to category 1. However, when k = 9, the ABSTRACT SPSS is powerful to analyze data clustering and forecasting. This paper intends to support people who are interesting the species of flowers the benefits of data forecasting with applied SPSS. It showed the species value forecasting based on sepal length and sepal width. As SPSS’s background algorithms, it showed the KNN algorithm for data clustering and data forecasting. It includes one sample data was downloaded from Google and was analyzed and viewed. It used IBM SPSS statistics version 23 and PYTHON version 3.7. KEYWORDS: SPSS is powerful to analyze data clustering and forecasting 1.INTRODUCTION Nowadays, flowers businesses are competing with others not to lose their market places in local and external regions. To avoid the loss of market places they should use data science technology. This paper used SPSS integrated with Python software. it showed the KNN algorithm for data clustering and data forecasting that includes three tables, one graph and one data analytical view. 1.1 SPSS SPSS, standing for Statistical Package for the Social Sciences, is a powerful, user friendly software package for the manipulation and statistical analysis of data. The package is particularly useful for students and researchers in psychology, sociology, psychiatry, and other behavioral sciences, containing as it does an extensive range of both univariate and multivariate procedures much used in these disciplines. new case is placed in category 0 because a majority of the nearest neighbors belong to category 0. Nearest neighbor analysis can also be used to compute values for a continuous target. In this situation, the average or median target value of the nearest neighbors is used to obtain the predicted value for the new case. 1.3. Scatter grams SPSS has plotted the relationship between two variables: 1.revision: How much revision an individual did for an exam (scored from 0 to 30 hours) by 2.Score: Exam Score (marked out of 30). on to a chart called a scatter gram. These two variables are not identical, but you would expect a strong positive relationship between them. When you have a ‘positive relationship’, the low values on one variable tend to go with low values on the other variable and high values on one variable tend to go with high values on the other. Here, we would expect that people doing only a small amount of revision for an exam should tend to score low on the exam, and people doing a lot of revision should tend to score high. When you have a ‘negative relationship’, the low values on one variable tend to go with high values on the other variable and high values on one variable tend to go with low values on the other.[4] IJTSRD26665 pp.1496-1498, BY 4.0) @ IJTSRD | Unique Paper ID – IJTSRD26665 | Volume – 3 | Issue – 5 | July - August 2019 Page 1496
International Journal of Trend in Scientific Research and Development (IJTSRD) @ www.ijtsrd.com eISSN: 2456-6470 2.Algorithm KNN Algorithms [1] Notation 3.Testing A.Table-1: Given Data Sepal Length Sepal Width 5.3 5.1 7.2 5.4 5.1 5.4 7.4 6.1 7.3 6 5.8 6.3 5.1 6.3 5.5 B.Unknown Point (Holdout data) Species setosa setosa virginica setosa setosa setosa virginica versicolor virginica versicolor virginica versicolor versicolor versicolor versicolor 3.7 3.8 3 3.4 3.3 3.9 2.8 2.8 2.9 2.7 2.8 2.3 2.5 2.5 2.4 Preprocessing Features are coded to account for differences in measurement scale. Sepal_Length= 5.2 Sepal_Width= Species 3.1 ? C.Table-2: Calculate distances and nearest(Training) Rank(K) Euclidean Distance 3 0.60828 6 0.70711 13 2.00250 2 0.36056 1 0.22361 8 0.82462 15 2.22036 10 0.94868 14 2.10950 9 0.89443 5 0.67082 12 1.36015 4 0.60828 11 1.25300 7 0.76158 D.Table-3: Ascending Order by Rank(K) K Species 1 setosa 2 setosa 3 setosa 4 versicolor 5 virginica 6 setosa 7 versicolor 8 setosa 9 versicolor 10 versicolor 11 versicolor 12 versicolor 13 virginica 14 virginica 15 virginica Species setosa setosa virginica setosa setosa setosa virginica versicolor virginica versicolor virginica versicolor versicolor versicolor versicolor Training Training a nearest neighbor model involves computing the distances between cases based upon their values in the feature set. The nearest neighbors to a given case have the smallest distances from that case. Euclidean Distance. The distance between two cases is the square root of the sum, over all dimensions, of the weighted squared differences between the values for the cases. @ IJTSRD | Unique Paper ID – IJTSRD26665 | Volume – 3 | Issue – 5 | July - August 2019 Page 1497
International Journal of Trend in Scientific Research and Development (IJTSRD) @ www.ijtsrd.com eISSN: 2456-6470 E.Graph-1: Given species and unknown species distribution by Sepal_Length*Speal_Width can get their goal with right flower species and can avoid the waste of time to know flowers species and the loss of market places in local and global regions by using SPSS software. References [1]IBM SPSS Statistics 24 Algorithms pdf book [book style] [2]A handbook of statistical analyses using SPSS / Sabine, Landau, Brian S. Everitt, ISBN 1-58488-369-3 [book style] [3]SPSS For Dummies®, 2nd Edition, ISBN: 978-0-470- 48764-8 [book style] [4]SPSS for Social Scientists Robert L. Miller, Ciaran Acton, Deirdre A. Fullerton and John Maltby, ISBN 0–333– 92286–7 [book style] <Profile> Aung Cho received the B.A.(Eco) degree from Yangon University M.I.Sc.(Information Science) degree from University of Computer Studies, Yangon in 2001. After got Master degree, I served as a teacher at the software, information science and application computer universities. I am now with University of Computer Studies, Maubin. Aung Si Thu received the B.Sc.(Hons)(Chemistry) degree from Magwe University in 2003 and M.I.Sc.(Information Science) degree from University of Computer Studies, Yangon in 2009. After got Master degree, I served as a teacher at the software, information science and hardware computer universities. I am now with University of Computer Studies, Maubin, Myanmar. in 1987 and F.Analytical views At first, trained the data of table-1 with unknown data (holdout data) by using KNN algorithm and got table-2 that includes the distances between given data and unknown point. In second, sorted the distances with ascending order by nearest distances or Rank(K) to get table-3 that is clear to look at result. The nearest species group is setosa-group for unknown data. As final, look at table-3 and graph-1. You can decide the species value for unknown data that is setosa. 4.Conclusion SPSS data analysis tools are valuable in social science, flowers business and marketing fields. It is very good for presentation report by graphical design. It showed the flowers species value forecasting based on sepal width and sepal length by using KNN algorithm that can cluster and forecast unknown data based on known data and then they departments of the departments of the @ IJTSRD | Unique Paper ID – IJTSRD26665 | Volume – 3 | Issue – 5 | July - August 2019 Page 1498