Download
1 / 4
40 likes | 44 Vues
SPSS is powerful to analyze business and marketing data. This paper intends to support business and marketing leaders the benefits of data forecasting with applied SPSS. It showed the sale quantity forecasting based on unit price and advertising. As SPSS's background algorithms, it showed the regression algorithm for data forecasting and ANOVA algorithm for data significant. It includes one sample data was downloaded from Google and was analyzed and viewed. It used IBM SPSS statistics version 23 and PYTHON version 3.7. Aung Cho | Aung Si Thu "Applied SPSS for Data Forecasting of Sale Quantity" Published in International Journal of Trend in Scientific Research and Development (ijtsrd), ISSN: 2456-6470, Volume-3 | Issue-5 , August 2019, URL: https://www.ijtsrd.com/papers/ijtsrd26378.pdf Paper URL: https://www.ijtsrd.com/computer-science/data-miining/26378/applied-spss-for-data-forecasting-of-sale-quantity/aung-cho<br>

E N D
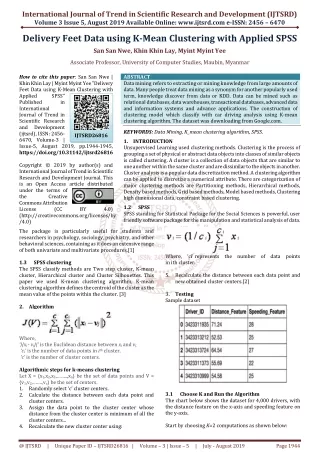
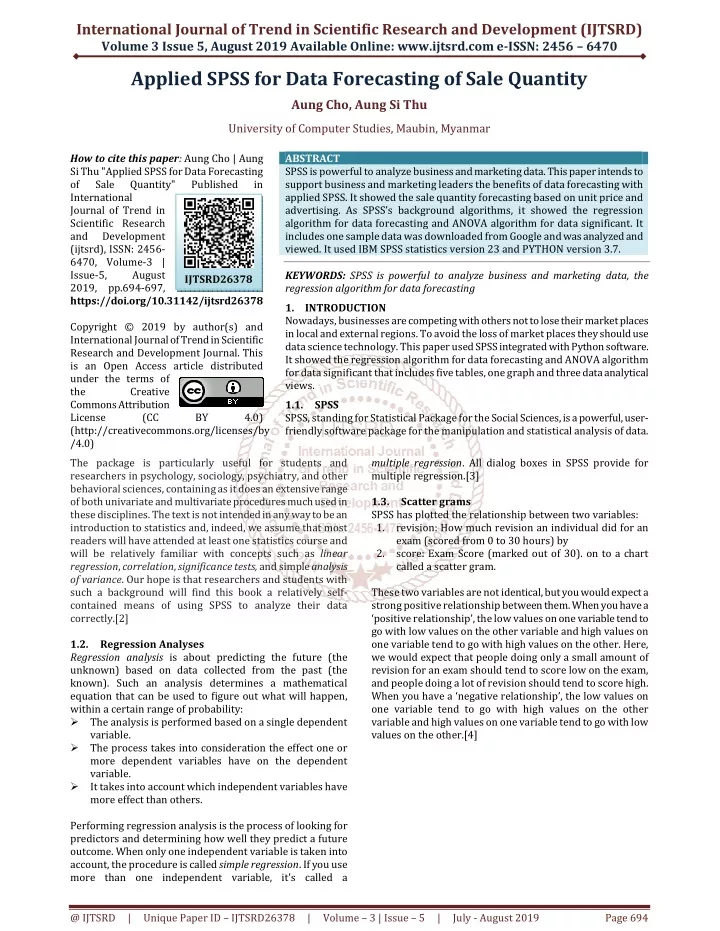
International Journal of Trend in Scientific Research and Development (IJTSRD) Volume 3 Issue 5, August 2019 Available Online: www.ijtsrd.com e-ISSN: 2456 – 6470 Applied SPSS for Data Forecasting of Sale Quantity Aung Cho, Aung Si Thu University of Computer Studies, Maubin, Myanmar How to cite this paper: Aung Cho | Aung Si Thu "Applied SPSS for Data Forecasting of Sale Quantity" International Journal of Trend in Scientific Research and Development (ijtsrd), ISSN: 2456- 6470, Volume-3 | Issue-5, August 2019, pp.694-697, https://doi.org/10.31142/ijtsrd26378 Copyright © 2019 by author(s) and International Journal of Trend in Scientific Research and Development Journal. This is an Open Access article distributed under the terms of the Creative Commons Attribution License (CC (http://creativecommons.org/licenses/by /4.0) The package is particularly useful for students and researchers in psychology, sociology, psychiatry, and other behavioral sciences, containing as it does an extensive range of both univariate and multivariate procedures much used in these disciplines. The text is not intended in any way to be an introduction to statistics and, indeed, we assume that most readers will have attended at least one statistics course and will be relatively familiar with concepts such as linear regression, correlation, significance tests, and simple analysis of variance. Our hope is that researchers and students with such a background will find this book a relatively self- contained means of using SPSS to analyze their data correctly.[2] 1.2.Regression Analyses Regression analysis is about predicting the future (the unknown) based on data collected from the past (the known). Such an analysis determines a mathematical equation that can be used to figure out what will happen, within a certain range of probability: ?The analysis is performed based on a single dependent variable. ?The process takes into consideration the effect one or more dependent variables have on the dependent variable. ?It takes into account which independent variables have more effect than others. Performing regression analysis is the process of looking for predictors and determining how well they predict a future outcome. When only one independent variable is taken into account, the procedure is called simple regression. If you use more than one independent variable, it’s called a ABSTRACT SPSS is powerful to analyze business and marketing data. This paper intends to support business and marketing leaders the benefits of data forecasting with applied SPSS. It showed the sale quantity forecasting based on unit price and advertising. As SPSS’s background algorithms, it showed the regression algorithm for data forecasting and ANOVA algorithm for data significant. It includes one sample data was downloaded from Google and was analyzed and viewed. It used IBM SPSS statistics version 23 and PYTHON version 3.7. KEYWORDS: SPSS is powerful to analyze business and marketing data, the regression algorithm for data forecasting 1.INTRODUCTION Nowadays, businesses are competing with others not to lose their market places in local and external regions. To avoid the loss of market places they should use data science technology. This paper used SPSS integrated with Python software. It showed the regression algorithm for data forecasting and ANOVA algorithm for data significant that includes five tables, one graph and three data analytical views. 1.1.SPSS SPSS, standing for Statistical Package for the Social Sciences, is a powerful, user- friendly software package for the manipulation and statistical analysis of data. Published in IJTSRD26378 BY 4.0) multiple regression. All dialog boxes in SPSS provide for multiple regression.[3] 1.3.Scatter grams SPSS has plotted the relationship between two variables: 1.revision: How much revision an individual did for an exam (scored from 0 to 30 hours) by 2.score: Exam Score (marked out of 30). on to a chart called a scatter gram. These two variables are not identical, but you would expect a strong positive relationship between them. When you have a ‘positive relationship’, the low values on one variable tend to go with low values on the other variable and high values on one variable tend to go with high values on the other. Here, we would expect that people doing only a small amount of revision for an exam should tend to score low on the exam, and people doing a lot of revision should tend to score high. When you have a ‘negative relationship’, the low values on one variable tend to go with high values on the other variable and high values on one variable tend to go with low values on the other.[4] @ IJTSRD | Unique Paper ID – IJTSRD26378 | Volume – 3 | Issue – 5 | July - August 2019 Page 694
International Journal of Trend in Scientific Research and Development (IJTSRD) @ www.ijtsrd.com eISSN: 2456-6470 2.Algorithm REGRESSION Algorithms[1] @ IJTSRD | Unique Paper ID – IJTSRD26378 | Volume – 3 | Issue – 5 | July - August 2019 Page 695
International Journal of Trend in Scientific Research and Development (IJTSRD) @ www.ijtsrd.com eISSN: 2456-6470 3.Testing B.Analytical view As table-3and 4, Significance F and P-values To check if your results are reliable (statistically significant), look at Significance F (0.001). If this value is less than 0.05, you're OK. If Significance F is greater than 0.05, it's probably better to stop using this set of independent variables. Delete a variable with a high P-value (greater than 0.05) and rerun the regression until Significance F drops below 0.05. Most of all P-values should be below 0.05. In our example, this is the case. (0.000, 0.001 and 0.005). As table-4, Coefficients The regression line is: y = Quantity Sold = 8536.214 - 835.722 * Price + 0.592 * Advertising. In other words, for each unit increase in price, Quantity Sold decreases with 835.722 units. For each unit increase in Advertising, Quantity Sold increases with 0.592 units. This is valuable information. You can also use these coefficients to do a forecast. For example, if price equals $4 and Advertising equals $3000, you might be able to achieve a Quantity Sold of 8536.214 - 835.722 * 4 + 0.592 * 3000 = 6970. Table-5: RESIDUAL OUTPUT Table-1: Sample Data SUMMARY OUTPUT Table-2: Regression Values A.Analytical view As Table-2 R Square equals 0.962, which is a very good fit. 96% of the variation in Quantity Sold is explained by the independent variables Price and Advertising. The closer to 1, the better the regression line (read on) fits the data. Table-3: Performance-1 Graph-1: Residuals Values Table-4: Performance-2 C.analytical Views As table-5 and graph-1 Residuals The residuals show you how far away the actual data points are from the predicted data points (using the equation). For example, the first data point equals 8500. Using the equation, the predicted data point equals 8536.214 -835.722 * 2 + 0.592 * 2800 = 8523.009, giving a residual of 8500 - 8523.009 = -23.009. @ IJTSRD | Unique Paper ID – IJTSRD26378 | Volume – 3 | Issue – 5 | July - August 2019 Page 696
International Journal of Trend in Scientific Research and Development (IJTSRD) @ www.ijtsrd.com eISSN: 2456-6470 4.Conclusion SPSS data analysis tools are valuable in social science, business and marketing fields. It is very good for presentation report by graphical design. It showed the sale quantity forecasting based on unit price and advertising before saleand then they can get their goal with right sale quantity and can avoid the waste of sale quantity and the lost of market places in local and global regions by using SPSS software. References [1]IBM SPSS Statistics 24 Algorithms pdf book [book style] Author Profile Aung Cho received the B.A.(Eco) degree from Yangon University in 1987 and M.I.Sc.(Information Science) degree from University of Computer Studies, Yangon in 2001. After got Master degree, I served as a teacher at the software, information science and application departments of the computer universities. I am now with University of Computer Studies, Maubin. Author Profile Aung B.Sc.(Hons)(Chemistry) degree from Magwe University in 2003 and M.I.Sc.(Information Science) degree from University of Computer Studies, Yangon in 2009. After got Master degree, I served as a teacher at the software, information science and hardware computer universities. I am now with University of Computer Studies, Maubin, Myanmar. [2]A handbook of statistical analyses using SPSS / Sabine, Landau, Brian S. Everitt, ISBN 1-58488-369-3 [book style] Si Thu received the [3]SPSS For Dummies®, 2nd Edition, ISBN: 978-0-470- 48764-8 [book style] [4]SPSS for Social Scientists Robert L. Miller, Ciaran Acton, Deirdre A. Fullerton and John Maltby, ISBN 0–333– 92286–7 [book style] departments of the @ IJTSRD | Unique Paper ID – IJTSRD26378 | Volume – 3 | Issue – 5 | July - August 2019 Page 697