Download
1 / 23
230 likes | 234 Vues
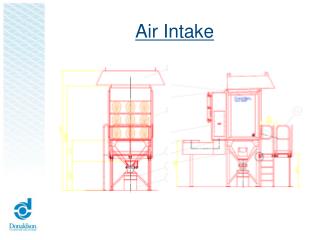
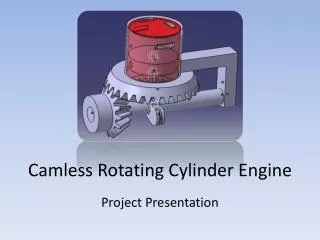
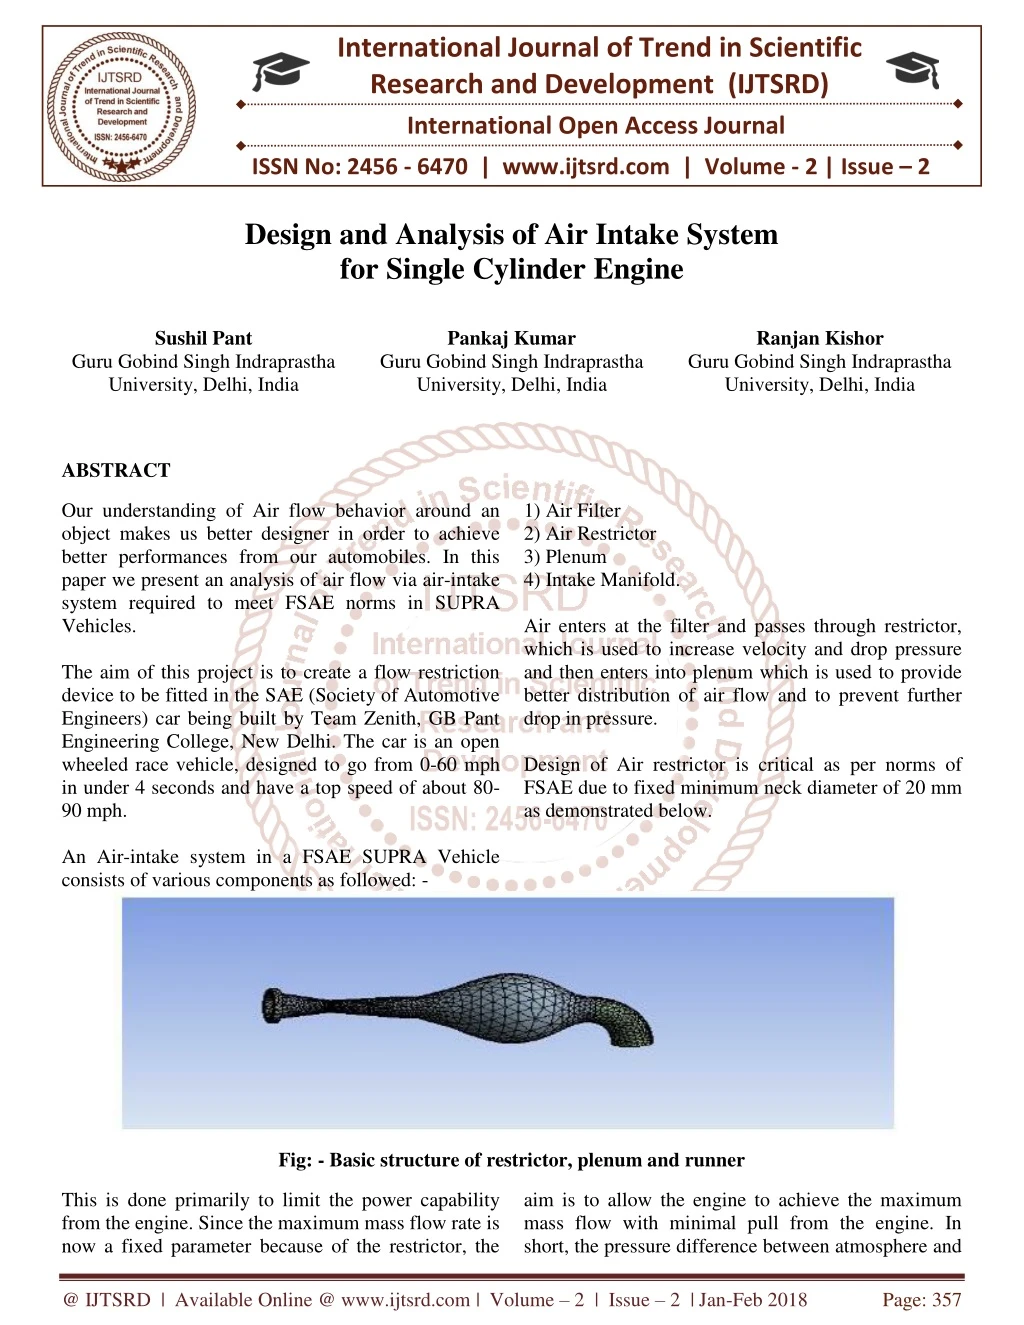
Our understanding of Air flow behavior around an object makes us better designer in order to achieve better performances from our automobiles. In this paper we present an analysis of air flow via air intake system required to meet FSAE norms in SUPRA Vehicles.The aim of this project is to create a flow restriction device to be fitted in the SAE Society of Automotive Engineers car being built by Team Zenith, GB Pant Engineering College, New Delhi. The car is an open wheeled race vehicle, designed to go from 0 60 mph in under 4 seconds and have a top speed of about 80 90 mph.An Air intake system in a FSAE SUPRA Vehicle consists of various components as followed 1 Air Filter2 Air Restrictor3 Plenum4 Intake Manifold.Air enters at the filter and passes through restrictor, which is used to increase velocity and drop pressure and then enters into plenum which is used to provide better distribution of air flow and to prevent further drop in pressure.Design of Air restrictor is critical as per norms of FSAE due to fixed minimum neck diameter of 20 mm as demonstrated below. Fig Basic structure of restrictor, plenum and runnerThis is done primarily to limit the power capability from the engine. Since the maximum mass flow rate is now a fixed parameter because of the restrictor, the aim is to allow the engine to achieve the maximum mass flow with minimal pull from the engine. In short, the pressure difference between atmosphere and the pressure created in the cylinder should be minimal, so that maximum airflow into the engine at all times.Our study revolves around finding such combination of angles of inclination and rise of the restrictor which should provide the vehicle maximum performance within limits directed by FSAE.We have simulated various design of Air restrictors based on different pair of angles for the Air restrictor that could make a significant impact in the performance of the engine. The software we used for the same are ANSYS, SolidWorks. Sushil Pant | Pankaj Kumar | Ranjan Kishor "Design and Analysis of Air Intake System for Single Cylinder Engine" Published in International Journal of Trend in Scientific Research and Development (ijtsrd), ISSN: 2456-6470, Volume-2 | Issue-2 , February 2018, URL: https://www.ijtsrd.com/papers/ijtsrd8388.pdf Paper URL: http://www.ijtsrd.com/engineering/automotive-engineering/8388/design-and-analysis-of-air-intake-system-for-single-cylinder-engine/sushil-pant<br>

E N D
International Journal of Trend in Scientific Research and Development (IJTSRD) International Open Access Journal ISSN No: 2456 - 6470 | www.ijtsrd.com | Volume - 2 | Issue – 2 Design and Analysis of Air Intake System for Single Cylinder Engine Sushil Pant Pankaj Kumar Ranjan Kishor Guru Gobind Singh Indraprastha University, Delhi, India Guru Gobind Singh Indraprastha University, Delhi, India Guru Gobind Singh Indraprastha University, Delhi, India ABSTRACT Our understanding of Air flow behavior around an object makes us better designer in order to achieve better performances from our automobiles. In this paper we present an analysis of air flow via air-intake system required to meet FSAE norms in SUPRA Vehicles. The aim of this project is to create a flow restriction device to be fitted in the SAE (Society of Automotive Engineers) car being built by Team Zenith, GB Pant Engineering College, New Delhi. The car is an open wheeled race vehicle, designed to go from 0-60 mph in under 4 seconds and have a top speed of about 80- 90 mph. An Air-intake system in a FSAE SUPRA Vehicle consists of various components as followed: - 1) Air Filter 2) Air Restrictor 3) Plenum 4) Intake Manifold. Air enters at the filter and passes through restrictor, which is used to increase velocity and drop pressure and then enters into plenum which is used to provide better distribution of air flow and to prevent further drop in pressure. Design of Air restrictor is critical as per norms of FSAE due to fixed minimum neck diameter of 20 mm as demonstrated below. Fig: - Basic structure of restrictor, plenum and runner This is done primarily to limit the power capability from the engine. Since the maximum mass flow rate is now a fixed parameter because of the restrictor, the aim is to allow the engine to achieve the maximum mass flow with minimal pull from the engine. In short, the pressure difference between atmosphere and @ IJTSRD | Available Online @ www.ijtsrd.com | Volume – 2 | Issue – 2 | Jan-Feb 2018 Page: 357
International Journal of Trend in Scientific Research and Development (IJTSRD) ISSN: 2456-6470 the pressure created in the cylinder should be minimal, so that maximum airflow into the engine at all times. Our study revolves around finding such combination of angles of inclination and rise of the restrictor which should provide the vehicle maximum performance within limits directed by FSAE. We have simulated various design of Air restrictors based on different pair of angles for the Air-restrictor that could make a significant impact in the performance of the engine. The software we used for the same are ANSYS, SolidWorks. INTRODUCTION AND LITERATURE REVIEW 1.1 INTRODUCTION the intake ports. A great manifold design can provide substantial performance advantage than a less optimal one. Design goal to be met by the intake manifold- • Low resistance to airflow • High air velocity for a given flow rate • Excellent fuel and air distribution throughout To achieve desired power and torque, air flow characteristics matter in respect to naturally aspirated engine. Getting air into engine is the key to make power. The imposed constraint is a single circular restrictor in the intake system, positioned between the throttle and the engine. All engine airflow passes through this restrictor of 20 mm diameter for gasoline-fueled cars which will decrease the engine performance. The only allowed sequence consists of a throttle, restrictor and engine. Keeping these requires in mind, the flow and pressure loss reduction in the engine intake region are investigated with computational fluid dynamics software. On the basis of theoretical and simulation study, the intake system is designed and analyzed and best model will be taken. The aim of this project is to create an air intake system to be fitted in the FSAE (Formula Society of Automotive Engineers) car. In order to comply with the rules of the competition imposed by FSAE, a single circular restrictor of 20mm diameter must be placed in the intake system between the throttle and the engine and all engine airflow must pass through the restrictor. This is done primarily to limit the power capability from the engine. The basic function of the intake manifold is to get the air from the carburetor or throttle body directed into 1.1- Intake Manifold Assembly with The Engine 2.To achieve enhanced engine performance by increasing the air flow. 3.To improve the throttle response of the engine. 1.2. OBJECTIVES The objectives of our study are as follows: 1.To increase the pressure recovery of air in air restrictor. @ IJTSRD | Available Online @ www.ijtsrd.com | Volume – 2 | Issue – 2 | Jan-Feb 2018 Page: 358
International Journal of Trend in Scientific Research and Development (IJTSRD) ISSN: 2456-6470 1.3. LITERATURE REVIEW We use models, prototypes and stimulators, either statically or overtime to develop data to better interpret and predict the results which are otherwise difficult to understand. T. The aforementioned use of the Venturi effect coupled with the optimization of plenum volume is essential in designing and building an effective intake. • Dustin Lindley: -One significant problem in designing the throttle is that the plate tends to jam against the back of the throttle, and may also flutter somewhat. Including these effects in the CFD model may help optimize the throttle design. • D.Ramasamy, Zamri.M, S.Mahendran, S.Vijayan:- When the pressure drop is decrease air is being quite freely admitted to the engine, which in turn means that more air and fuel is being provided to it, which generates more power. • Mark Claywell and Donald Horkheimer: - The use of swirl inducing vanes upstream of the restrictor throat provided no benefit in terms of volumetric efficiency improvement. Any swirl generated by the vanes was quickly dampened out downstream of the throat. However, more aggressive swirl vanes might prove more promising and should be considered in future research. • PrimožPogorevc, Breda Kegl:- The CFD software can provide 3D numerical simulations of theintake system constant pressure drop between inlet and outlet. By changing the diameter of inlet we can vary the outlet conditions and by controlling the air pressure engine performance can be increased. • David Apgood, Cameron Blaylock, Joshua Crump: - Pipe geometry and length affect how pressure waves propagate through the system. Ricardo Wave is an industry-used software performance and accounts for wave propagation. • Sachin N Waghmare, Nikhil S Karekar , Pankaj P Karande , Santosh BPandhare: - Various intake designs were studied like top/centre feed intake, side entry intake, and conical spline intake designs. The fluid flow through the intake was analyzed using CFD flow modelling software. The CFD results observed the converging and diverging angles of 12 degree and 6 degree respectively achieving minimum pressure drop. that models engine • Shubham Raj, Tuhin Srivastava: -The optimum solution to achieve maximum possible mass flow rate of air as quickly as possible is to minimize the pressure loss through the flow restriction device. The best way to achieve is to pass through the venture design. • Ryan Ilardo, Christopher B. William: - The manifold that resulted from the process greatly improved the performance of the Formula SAE engine, as compared to a similar aluminum design. The new design provided an increase in torque over an extended RPM range as the manufacturing process provided the ability to create a complex geometry that provided equal air to each cylinder and reduced total pressure drop. • HONG HAN-CHI, HUANG HONG-WU, BAI YI- JIE: -The design of intake and exhaust system was determined by using Orthogonal Array Testing Strategy. The optimal results can offset the effect of restrictor, and improve the restricted engine’s ability effectively in the high speed range.The cam timing should be studied together with the intake and exhaust system to tuning the restricted FSAE engine. • Anish Ganesh, Intake System Designer, University of Waterloo Formula Motorsports: - Fluid flow simulation is a vital tool for engine system developers. The ability to improve pressure recovery and minimize flow separation in the restrictor design has allowed the team to maximize the performance and efficiency of the new powerplant. • AnshulSinghal, MallikaParveen, Member, IAENG: - This is done primarily to limit the power capability from the engine. Since the maximum mass flow rate is now a fixed parameter because of the restrictor, the aim is to allow the engine to achieve the maximum mass flow with minimal pull from the engine. In short, the pressure difference between atmosphere and the pressure created in the cylinder should be minimal, so that maximum airflow into the engine at all times. •Nimesh Shukla, Kalpesh Vaghela: - Use of CFD helps to reduce the pressure drop by 18% and temperature by 37% leading to fuel economy advantage of 1%. The development process, system design specifications, packaging/clearance checklist and design review checklist are evolved through a regressive process. • Stephan Becker, Peter Farnum, Jacob Morissette, Dwight Whitney: -Some preliminary research has been done in determining parameters to focus on when designing an intake for a V-Twin Formula SAE Car. @ IJTSRD | Available Online @ www.ijtsrd.com | Volume – 2 | Issue – 2 | Jan-Feb 2018 Page: 359
International Journal of Trend in Scientific Research and Development (IJTSRD) ISSN: 2456-6470 wave is below the ambient pressure and the opposite holds true for expansion waves. The propagation of pressure waves and the mass flow rate that they induce is dependent on the gas properties, the specific heats, pressure and temperature. Design Theory • Abhishek Raj, J.C. Mohanta, Bireswar Paul, Mohd. Nayab Zafar: -In order to improve the performance of internal combustion engine the performance of intake manifold must be improve because efficiency of IC engine is highly depending upon the performance of intake manifold. In order to improve the performance of intake manifold the geometry of runner and plenum must be improve to reduce the pressure losses so that there must be high mass flow rate and even distribution of fuel/air to each runner. If the plenum was fed from centre rather than from one edge flow was enhanced significantly in all cylinders. 2. METHODOLOGY Intake Manifold Various design theories have been suggested throughout the history development. The basic layout of the fuel injection manifold will be determined by its application. A racing application will generally tend toward a design with one throttle plate per cylinder. Typically, a street manifold will employ just one throttle plate or one multi-plate progressive throttle body attached to a plenum that that will feed all cylinders. Because we are dealing with everyday user motorcycle single cylinder engine, we opt for the single throttle body design because it generates a considerably crisper intake manifold vacuum signal. This greatly increases the accuracy with which low speed fuel and ignition can be calibrated and is this thus better suited to a street-driven engine. Of the single plate throttle two plenum design theories. The dual plenum and single plenum design. Though both design theories have their own benefits and disadvantages. The main deciding factor is that we are using single cylinder engine, so the use of dual plenum design is irrelevant to us. 2.1. AIR RESTRICTOR DESIGN 2.1.1 Using Orifice Plate of intake manifold The intake manifold connects the throttle body to the intake ports on the cylinder head. A manifold has a plenum or an air chamber where air is stored and a set of runners connected to the intake ports of the engine on the engine head. With port fuel injection, only air flows through the manifold and the top half of the runner. Fuel is injected into the air as it flows through the intake ports. When the throttle valve opens, air flows into the plenum. During the intake stroke, the intake valve opens and air-fuel mixture flows through the runners into the cylinder where combustion takes place. This auto part is not just a passageway for the mixture to flow into but it also contributes to a better distribution of the fuel and air. Gas Flow through the Intake of the Engine The gas flow process into, through and out of the engine are all unsteady. Unsteady gas is defined as that which the pressure, temperature and the gas particle velocity in a closed duct are variable with time. In the case of induction flow into the cylinder through an intake valve whose area changes with time, the intake pipe pressure alters because the cylinder pressure is affected by the piston motion causing volumetric change within that space. The flow in and out of an internal combustion engine all happens in pulses and for this reason air can be visualized to travelling as pressure waves. Pressure waves are of two types. They are either compression waves or expansion waves. Compression waves are pressure waves where the pressure on any point on the An orifice plate is a device used for measuring flow rate, for reducing pressure or for restricting flow (in the latter two cases it is often called a restriction plate). The shape of a restrictor can be as simple as a plate with the mandated dimensions machined into it, and placed anywhere along the air intake system. However, a simple orifice plate would create a lot of pressure loss downstream of the restrictor, and the resultant effect is an increased inefficiency along the line of airflow.Due to the large friction losses from the eddies generated by the re-expanding jet below the vena contracta, the pressure recovery in an Orifice meter is poor. @ IJTSRD | Available Online @ www.ijtsrd.com | Volume – 2 | Issue – 2 | Jan-Feb 2018 Page: 360
International Journal of Trend in Scientific Research and Development (IJTSRD) ISSN: 2456-6470 Fig 2.1: - Orifice 2.1.2 Converging-Diverging Nozzle Venturi meters are flow measurement instruments which use a converging section of pipe to give an increase in the flow velocity and a corresponding pressure drop from which the flow rate can be deduced. In the Venturi design there is no formation of vena-contracta also the net losses due to friction are very low. High pressure and energy recovery makes the Venturi suitable where only small pressure heads are available. The Venturi meter is used for measuring the flow rate through an incompressible fluid stream whereas a nozzle involves flow of a compressible fluid. However, the nozzle functions in the same way as a venturi and thus the same principles which are stated above apply to the nozzle (except of the fact that we have to consider the flow as compressible without neglecting the frictional losses). Table 1: - Comparison between orifice and nozzle Parameters Orifice Plate Nozzle Coefficient of Discharge 0.60 0.975 Pressure Loss High Low Frictional Losses High Low The Converging-Diverging Nozzle type restrictor would be best suitable for the FSAE car due to high coefficient of discharge, low pressure loss and low frictional losses. Different converging-diverging angles will be tested in computational fluid dynamics analysis. Combination of the angle with minimum delta pressure (inlet pressure-outlet pressure) will be chosen for the final design. Fig 2.2: - Venturi/Nozzle @ IJTSRD | Available Online @ www.ijtsrd.com | Volume – 2 | Issue – 2 | Jan-Feb 2018 Page: 361
International Journal of Trend in Scientific Research and Development (IJTSRD) ISSN: 2456-6470 2.1.3 Engine air flow calculations Where γ is the specific heat ratio, R is the gas constant, and T is the temperature. Theoretical Mass flow rate can be calculated as follows, Now substitute (2) into (1): m = A M To calculate mass flow rate, we need to calculate CFM (Cubic Feet per Minute) R T Eqs.3 CFM = Engine size in (inch) ^ x RPM x Volumetric efficiency/3456 The equation of state is: P (R T) (1cc 0.00047194745m3/s) =0.0610233(inch) ^ 3 & 1CFM = Eqs.4 Mass flow rate = Volume flow rate x density of air Where P is the pressure, Substitute (4) into (3): The mass flow rate comes out to be 0.0332kg/s. 2.1.4 Constants and Variables CHOKE FLOW CONDITION m AM (R T ) P (R T ) Eqs.5 Inlet pressure is taken equal to 1atm and outlet pressure has several values. For every combination of these available boundary conditions, angles will be varied and results will be plotted. To initialize the flow analysis, we need boundary conditions to fix the state of the domain. We have inlet pressure as the first boundary condition. m A(R) M P T Eqs.6 From the isentropic flow equations: P Pt (T Tt )^ ( (-1)) Eqs.7 For boundary conditions at outlet of CD nozzle we can have either pressure, velocity or mass flow rate. Calculating pressure and velocity at outlet of nozzle involves complex procedures and thus gives rise to some errors. Mass flow rate at outlet can be easily calculated by using choked flow equation. Where Pt is the total pressure and Tt is the total temperature. Substitute (7) into (6): Eqs.8 The conservation of mass (continuity) tells us that the mass flow rate through a tube is a constant and equal to the product of the density ρ, velocity V, and flow area A: Another isentropic relation gives: T / Tt (1 .5 ( 1) M ^2)^-1 Eqs.9 Substitute (9) into (8): ? = ? × ? × ? Eqs.1 Considering the mass flow rate m equation, it appears that, we could increase ‘ ’ for a given area A and a fixed density the mass flow rate indefinitely by simply increasing the velocity ‘v’. In real fluids, however, the density does not remain fixed as the velocity increases because of compressibility effects. We have to account for the change in density to determine the mass flow rate at higher velocities. If we start with the mass flow rate equation given above and use the isentropic flow relations and the equation of state, we can derive a compressible form of the mass flow rate equation. We begin with the definition of the Mach number M and the speed of sound ‘a’ V M a M R T Eqs.10 This equation relates the mass flow rate to the flow area A, total pressure Pt and temperature Tt of the flow, the Mach number M, the ratio of specific heats of the gas γ, and the gas constant R. Calculating maximum mass flow rate from above equation using available data values as stated below: The values taken for substitution in Equation (10) are: Pt = 101325 Pa T = 300K = 1.4 R (air) =0.286 kJ/Kg-K Eqs.2 @ IJTSRD | Available Online @ www.ijtsrd.com | Volume – 2 | Issue – 2 | Jan-Feb 2018 Page: 362
International Journal of Trend in Scientific Research and Development (IJTSRD) ISSN: 2456-6470 A = 0.001256 m2 India Supra. Throat diameter as per SAE rules is fixed to 20mm. M = 1 (Choking Conditions) Various values of delta pressure for different values of converging and diverging angles where θ1 is the converging angle and θ2is the diverging angle of nozzle. Where θ1 and θ2 are in degrees and delta pressure values are in Pascal. On the basis of the minimum pressure drop from the table after doing the flow analysis in solid works, restrictor with 12 degree converging and 6 degree diverging angle is selected as the final geometry. Result: Mass Flow Rate at Choking = 0.0703 kg/s This is second boundary condition which will be applied at the exit of venturi. Thus, we are ready all our known and unknown parameters to proceed for calculations. 2.2. ANALYSIS OF RESTRICTOR 3-D models were created for various converging and diverging angles. As the inlet diameter is fixed to 48mm. Length of the restrictor was selected to be 200mm due to the packaging constrained rule of SAE Table 2: -Delta Pressure Table θ2 4 6 8 10 12 15 20 θ1 DELTA PRESSURE 18121.28 10 12 14 15 16 18186.16 14642.99 17990.93 16186.16 10150.69 14907.41 18324.84 19949.43 20958.26 18903.64 20861.03 22354.55 16058.77 15234.77 17061.91 16027.17 17605.8 19798.08 21192.27 23181.57 16428.94 19149.17 21679.45 22172.72 19854.06 19451.52 21385.12 21864.23 18382.93 16806.88 19174.02 19654.68 20794.06 24331.42 20867.50 18 20 20137.65 18787.06 20334.95 21522.25 22446.62 22806.98 20667.64 19069.05 20721.15 24436.96 22987.19 21919.60 24689.06 Fig. 2.3: - Min. delta pressure chart @ IJTSRD | Available Online @ www.ijtsrd.com | Volume – 2 | Issue – 2 | Jan-Feb 2018 Page: 363
International Journal of Trend in Scientific Research and Development (IJTSRD) ISSN: 2456-6470 Inlet pressure of all the restrictors is same as atmospheric pressure. Pressure varies as we go along the length of the restrictor. We have analyzed the graphs of selected converging and diverging angles. On the basis of the minimum pressure drop from the table which we have made on the simulation basis and from the graphs plots, restrictor with 12 degree converging and 6 degree diverging angle is selected as the final geometry. We can very well analyze from the graph that the pressure recovery for 12 degree converging and 6 degree diverging angle is much greater. Fig.2.4: - Final restrictor 3-d model built in solidworks This is the air restrictor model created in the SOLIDWORKS software. The final model is selected on the basis of the minimum pressure loss between the inlet and the outlet face. The restrictor length is constrained to 160mm. The inlet diameter is 48mm and the converging & diverging angle comes out as 12degrees and 6 degrees respectively. Fig.2.5: - Pressure contour @ IJTSRD | Available Online @ www.ijtsrd.com | Volume – 2 | Issue – 2 | Jan-Feb 2018 Page: 364
International Journal of Trend in Scientific Research and Development (IJTSRD) ISSN: 2456-6470 Fig.2.6: - Pressure graph plot The main aim is to minimize the delta pressure. Boundary conditions applied to find the delta pressure are: (a) Inlet pressure = ambient pressure and (b) Outlet mass flow rate = 0.0703kg/s. Pressure decreases as we go along the length of restrictor Fig.2.7: - Density contour Fig.2.8: - Density Plot Density contour is obtained for the final selected model by doing the flow analysis on the solidworks flow simulation. Red contour is showing as the maximum density and blue showing minimum. @ IJTSRD | Available Online @ www.ijtsrd.com | Volume – 2 | Issue – 2 | Jan-Feb 2018 Page: 365
International Journal of Trend in Scientific Research and Development (IJTSRD) ISSN: 2456-6470 Fig.2.9: - Velocity Contour Fig.2.10: - Velocity Plot Velocity contour is showing as minimum velocity as the inlet and as the area decreases the flow velocity increases but it is under Mach1 so there will be no choke flow at the throat. Outlet side has increasing area so velocity will decrease as well and at the surface turbulence can be seen. 2.3. PLENUM enables the plenum to operate at a high volumetric efficiency when equalizing air flow to the engine cylinders. For optimizing plenum shape, CFD analysis will be done. We have chosen different shapes such as vertical cylinder, conical shape, and sphere shaped. Their analysis results will then be compared to select the best plenum shape. Plenum is an air chamber or an air reservoir which stores air at positive pressure. There are no theoretical calculative evidences to find exact size of the plenum. Automotive engineers generally prefer large plenum volume up to 2-3 times the engine displacement. As rpm goes up you need a larger plenum, but a larger plenum will reduce throttle response and low-end power. A plenum also minimizes peak air velocity through the carburetor (or throttle body). The induction pulses in an intake cause velocity to rise and fall with each pulse. Inlet boundary condition was 1 atmospheric pressure and outlet condition was outlet pressure which is taken from analysis results of Solidwork flow simulation of whole intake system. In Horizontal cylindrical and conical shape, back flow and vortices were created during the flow analysis. Sinusoidal shape was also tested and results were Intake manifold runners take advantage of the Helmholtz Resonance phenomenon, which results in air resonance in a cavity, such as the plenum. When a valve closes, air outside of the valve compresses against it, creates a pocket of high pressure. This pressure equalizes with lower pressure in the plenum, which creates cycles, or pulses, of oscillation. This @ IJTSRD | Available Online @ www.ijtsrd.com | Volume – 2 | Issue – 2 | Jan-Feb 2018 Page: 366
International Journal of Trend in Scientific Research and Development (IJTSRD) ISSN: 2456-6470 recorded. It was seen that with a sufficient pressure drop, no back flow with minimum turbulence and no vortices were formed. Also, velocity values are higher compared with other plenum shape, so sinusoidal shape was chosen. 2.4. INTAKE RUNNER Intake manifolds usually employ runners, individual tubes extending to each intake port on the cylinder head which emanate from a central volume or "plenum" beneath the carburetor. The purpose of the runner is to take advantage of the Helmholtz resonance property of air. 2.4.1 Helmholtz Theory intake runner with its intake valve open constitutes a Helmholtz resonator. 2.4.2 Acoustic Resonance Charging Let us visualize the intake cycle of the engine as air flowing through the intake manifold runner, past the intake valve, and into the cylinder. Everything is fine and dandy until the intake valve shuts. Here is where the law of inertia comes to play -- because the air was in motion, it wants to stay in motion. But the air can't go anywhere because the valve is shut so it piles up against the valve like a chain reaction accident on the freeway. With one piece of air piling up on the next piece of air on the next on the next, the air becomes compressed. This compressed air has to go somewhere so it turns around and flows back through the intake manifold runner in the form of a pressure wave. Helmholtz theory addresses the fact that an Internal Combustion Engine creates pressure waves that propagate in the engines intake system. Air compressibility can be linked to a spring force introducing resonance in the intake manifold as the wave propagation takes place. A single cylinder and Fig.2.11: - Column of air-fuel inside the intake port This pressure wave bounces back and forth in the runner and if it arrives back at the intake valve when the valve opens, it is drawn into the engine. This bouncing pressure wave of air and the proper arrival time at the intake valve creates a form of acoustic supercharging. 2. The number of crank rotation degrees the intake valve is closed 3. Length of the intake runner tube 4. Volume of the plenum 5. Diameter of the intake runner 2.5. CALCULATIONS Engine Specifications In order to create this supercharging, all of the geometric variables of the intake manifold have to be aligned so the pressure wave arrives at the intake valve at the right time. This combination of synchronized events is known as 'resonant conditions'. Engine Manufacturer Name - KTM-Sportmotorcycle AG The following parameters affect resonance charging: - Engine displacement - 390cc (specifically 373.2cc) 1. Engine speed Engine Type - Single cylinder, Four Stroke, Liquid cooled @ IJTSRD | Available Online @ www.ijtsrd.com | Volume – 2 | Issue – 2 | Jan-Feb 2018 Page: 367
International Journal of Trend in Scientific Research and Development (IJTSRD) ISSN: 2456-6470 Power - 43BHP@9000rpm V = Pressure Wave Speed =1125ft/s or 343m/s Torque - 35N-m@7000rpm D = Runner Diameter = 48mm/1.89inches Bore - 89mm EVCD = 720 - (ECD-30) Stroke - 60mm EVCD = 720-226+30=524º Valve per cylinder - 4 30º is subtracted such that pressure waves to arrive before the valve closes and after it opens EVCD = 524º. Intake valve opens - 2˚ before top dead center (TDC) Intake valve closes - 44˚ after bottom dead center (BDC) According to induction wave tuning theory, intake system was tuned at 5000 RPM, resulting in total runner length of 359.032mm. Runner Diameter is selected as 48 mm same as throttle body as both are connected through fasteners. Effective Cam Duration - 226˚ The formula for optimum intake runner length (L) is: L (0.5×RUNNER DIAMETER) = (EVCD×0.25×V×2/RPM×RF) – 3.RESULTS AND DISCUSSIONS = (524º ×0.25×1125×2/5000× 4) – (0.5×1.8897) L =350.033mm Different geometries of plenum were simulated and the results were recorded. RV = Reflective Value Fig.3.1: - Pressure plot of different plenum geometries @ IJTSRD | Available Online @ www.ijtsrd.com | Volume – 2 | Issue – 2 | Jan-Feb 2018 Page: 368
International Journal of Trend in Scientific Research and Development (IJTSRD) ISSN: 2456-6470 Fig.3.2: - Density plot of plenum geometries Fig.3.3: - Vorticity curves of plenum geometries Above are the pressure, velocity and vorticity curves. As we can see from the pressure plot cylindrical plenum has the maximum pressure drop and the density of air inside the cylindrical plenum is also less as compared to the other two geometries. Vorticity is also high inside the cylindrical plenum geometry. So, we have discarded the cylindrical shape. Now, we have remained with the spherical and sinusoidal geometries. Pressure and density variations are almost similar inside the spherical and sinusoidal shape but if we look into the vorticity curve then we can analyze that the vorticity inside the spherical shape increases more than the sinusoidal geometry. So, on the basis of the above analysis, we have selected the sinusoidal plenum geometry as the final model. @ IJTSRD | Available Online @ www.ijtsrd.com | Volume – 2 | Issue – 2 | Jan-Feb 2018 Page: 369
International Journal of Trend in Scientific Research and Development (IJTSRD) ISSN: 2456-6470 Volume of plenum is selected as 800cc approx 2 times the engine displacement. Combine length of plenum and runner is calculated 363mm.Runner length is 163mm and is designed to get the low-end torque. Fig.3.4: - Restrictor with Plenum @ IJTSRD | Available Online @ www.ijtsrd.com | Volume – 2 | Issue – 2 | Jan-Feb 2018 Page: 370
International Journal of Trend in Scientific Research and Development (IJTSRD) ISSN: 2456-6470 Fig.3.5: - Runner 22 @ IJTSRD | Available Online @ www.ijtsrd.com | Volume – 2 | Issue – 2 | Jan-Feb 2018 Page: 371
International Journal of Trend in Scientific Research and Development (IJTSRD) ISSN: 2456-6470 Fig.3.6: - Flange connector Fig.3.7: - Assembly Of The Model 23 @ IJTSRD | Available Online @ www.ijtsrd.com | Volume – 2 | Issue – 2 | Jan-Feb 2018 Page: 372
International Journal of Trend in Scientific Research and Development (IJTSRD) ISSN: 2456-6470 Fig3.8: - Final assembly of the manifold with the engine 3.1. GENERATION OF MESH Select the whole model for meshing. We used tetrahedrons method control to mesh the entire model. Model consists of 3500 nodes and 13500 elements. In the concentrated areas mesh is more refined than in the other areas. Default element size was chosen to run the mesh generation. The model is submitted for the mesh generation and below are the visible results: @ IJTSRD | Available Online @ www.ijtsrd.com | Volume – 2 | Issue – 2 | Jan-Feb 2018 Page: 373
International Journal of Trend in Scientific Research and Development (IJTSRD) ISSN: 2456-6470 Fig. 3.9: - Generation of mesh in the model 3.2. GOVERNING EQUATIONS FOR FLOW ANALYSIS In fluid regions SOLIDWORKS Flow Simulation solves the Navier-Stokes equations, which are formulations of mass, momentum and energy conservation laws: 3.3.TURBULANCE MODEL K-epsilon (k-ε) turbulence model is the most common model used in Computational Fluid Dynamics (CFD) to simulate mean flow characteristics for turbulent flow conditions. It is a two-equation model which gives a general description of turbulence by means of two transport equations (PDEs). •The first transported variable determines the energy in the turbulence and is called turbulent kinetic energy (k). •The second transported variable is the turbulent dissipation (ε) which determines the rate of dissipation of the turbulent kinetic energy. SOLIDWORKS Flow Simulation is able to consider both laminar and turbulent flows. Laminar flows occur at low values of the Reynolds number, which is defined as the product of representative scales of velocity and length divided by the kinematic viscosity. When the Reynolds number exceeds a certain critical value the flow transitions smoothly to turbulent. To predict turbulent flows, the Favre-averaged Navier-Stokes equations are used, where time-averaged effects of the flow turbulence on the flow parameters are considered, whereas the large-scale, time-dependent phenomena are taken into account directly. Through this procedure, extra terms known as the Reynolds stresses appear in the equations for which additional information must be provided. To close this system of equations, SOLIDWORKS Flow Simulation employs transport equations for the turbulent kinetic energy and its dissipation rate, using the k-ε model. The modified k-ε turbulence model with damping functions proposed by Lam and Bremhorst (1981) describes laminar, turbulent, and transitional flows of homogeneous fluids consisting of the following turbulence conservation laws: @ IJTSRD | Available Online @ www.ijtsrd.com | Volume – 2 | Issue – 2 | Jan-Feb 2018 Page: 374
International Journal of Trend in Scientific Research and Development (IJTSRD) ISSN: 2456-6470 Lam and Bremhost’s damping functions fμ, f1, f2 decrease turbulent viscosity and turbulence energy and increase the turbulence dissipation rate when the Reynolds number Rу based on the average velocity of fluctuations and distance from the wall becomes too small. When fμ =1, f1 =1, f2 =1 the approach reverts back to the original k-ε model. The heat flux is defined by: @ IJTSRD | Available Online @ www.ijtsrd.com | Volume – 2 | Issue – 2 | Jan-Feb 2018 Page: 375
International Journal of Trend in Scientific Research and Development (IJTSRD) ISSN: 2456-6470 Here the constant σc=0.9, Pr the Prandtl Number, and h is the thermal enthalpy. 3.4.FLOW ANALYSIS RESULTS Now the analysis is run on the model to get the desired results. Solid works flow simulation is used to do the flow simulation. Fig.3.10: - Pressure Contour Fig.3.11: - Density Contour @ IJTSRD | Available Online @ www.ijtsrd.com | Volume – 2 | Issue – 2 | Jan-Feb 2018 Page: 376
International Journal of Trend in Scientific Research and Development (IJTSRD) ISSN: 2456-6470 Fig.3.12: - Velocity Contour From above three results we have concluded the variation of pressure, velocity and density. We have some pressure drop across the model which is necessary. Pressure difference is necessary for the flow of air. Density also is maintained throughout the geometry. 3.5.FLOW INSIDE THE MODEL Fig.3.13: - Pressure streamline @ IJTSRD | Available Online @ www.ijtsrd.com | Volume – 2 | Issue – 2 | Jan-Feb 2018 Page: 377
International Journal of Trend in Scientific Research and Development (IJTSRD) ISSN: 2456-6470 Fig.3.14: - Velocity streamline CONCLUSIONS AND SCOPE OF FUTURE WORK 4.1. CONCLUSIONS 1.The air intake system was successfully designed and simulated for SUPRA SAE INDIA 2017 race car. 2.The purpose of compensating the pressure, air density losses because of restrictor of 20 mm according to SAE rulebook was achieved. 3.More than desired mass flow rate was achieved, which is good to reduce the engine effort to pull the air into the cylinder. 4.The resonating effect of air was tried to achieve so that we can get the maximum performance in the desired rpm range. 5.In the entire project work different geometries were modelled and the flow simulation was done respectively and the air restrictor with 12 degree converging and 6 degree diverging angle suffers the minimum pressure drop. 6.Among the different sinusoidal plenum geometry gives the best results. 7.We have the sufficient pressure drop to flow the air downside to the intake port. 2.For transient flow analysis, we need some simulative data to run the simulation model. To do this we must practically dyno-test the engine and analyze those results. So, dyno testing can give the exact result for this analysis. 3.Along with SOLIDWORKS flow simulation; we need to simulate the entire model with practical parameters of KTM DUKE 390 on RICARDO WAVE engine simulation software to analyze the performance parameters. Based on the results we can make changes to the current model and improvise the current performance. REFERENCES 1.AbdulnaserSyma, “Computational Dynamics,” 1st http://bookboon.com/en/textbooks/energyenviron ment/computational-fluid-dynamics model for better Fluid Available: edition. 2.Anish Ganesh, “Students Win Using Simulation- Driven Design,” University of Waterloo Formula Motorsports, Canada. http://www.idac.co.uk/enews/articles/Students- Win-Using-Sim-Driven-Design.pdf plenum geometries Available at: 4.2. SCOPE OF FUTURE WORK 3.Antonio Gomes, “Documentation of the Engine Design Process for FSAE,” Department of Mechanical and Industrial EngineeringUniversity of Toronto, March http://www.studymode.com/essays/The-Anlyse- Of-Intake-1258959.html 1.We have all the results only on the simulation basis. As we know pressure inside the manifold is not steady but it varies with time. So instead of doing steady flow analysis, transient flow analysis would be better for these types of analysis. 2007. Available at: @ IJTSRD | Available Online @ www.ijtsrd.com | Volume – 2 | Issue – 2 | Jan-Feb 2018 Page: 378
International Journal of Trend in Scientific Research and Development (IJTSRD) ISSN: 2456-6470 4.ASME MFC-7M, Measurement of Gas Flow by Means of Critical Flow Venturi Nozzles. New York: American Society of MechanicalEngineers; 1987. 5.Bean, H. S., ed. Fluid Meters: Their Theory and Application, 5thedition. New York: The American Society of Mechanical Engineers;1959. 6.Deepak Ranjan Bhola, “CFS Analysis of Flow Through Venturi Of ACarburetor,” National Institute of Technology Rourkela, Rourkela – 769008, India, May http://ethesis.nitrkl.ac.in/2296/1/final_report.pdf 2011. Available at: 7.Orifice Plate description – Flow through an Orifice, Available en.wikipedia.org/wiki/Orifice_plate, Consulted on – 2 Feb 2013 at: 8.Venturi description – Flow through a Venturi Available en.wikipedia.org/wiki/Venturi_effect, on – 20 Jan 2013 www.grc.nasa.gov/WWW/k- 12/airplane/mflchk.html, Consulted on –15 Feb 2013 at: consulted 9.Neal Persaud, “Design and Optimization Of a Formulae SAE CoolingSystem,” Department of Mechanical and Industrial Engineering,University Of Toronto, March http://docsse.com/view.php?id=856504 2007. Available at: 10.FSAE Variable Air Intake Consulted on – 22 JAN 2013 http://poisson.me.dal.ca/~dp_06_9/concept.htm @ IJTSRD | Available Online @ www.ijtsrd.com | Volume – 2 | Issue – 2 | Jan-Feb 2018 Page: 379