Download
1 / 8
80 likes | 83 Vues
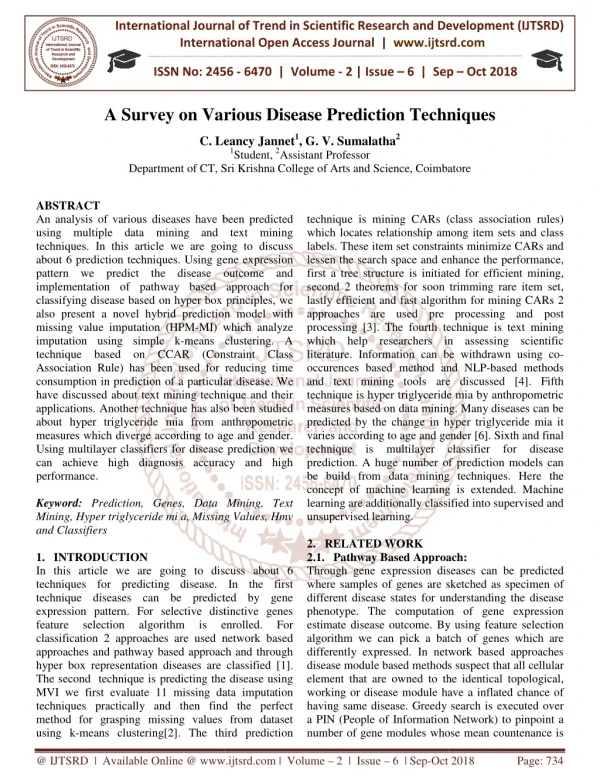
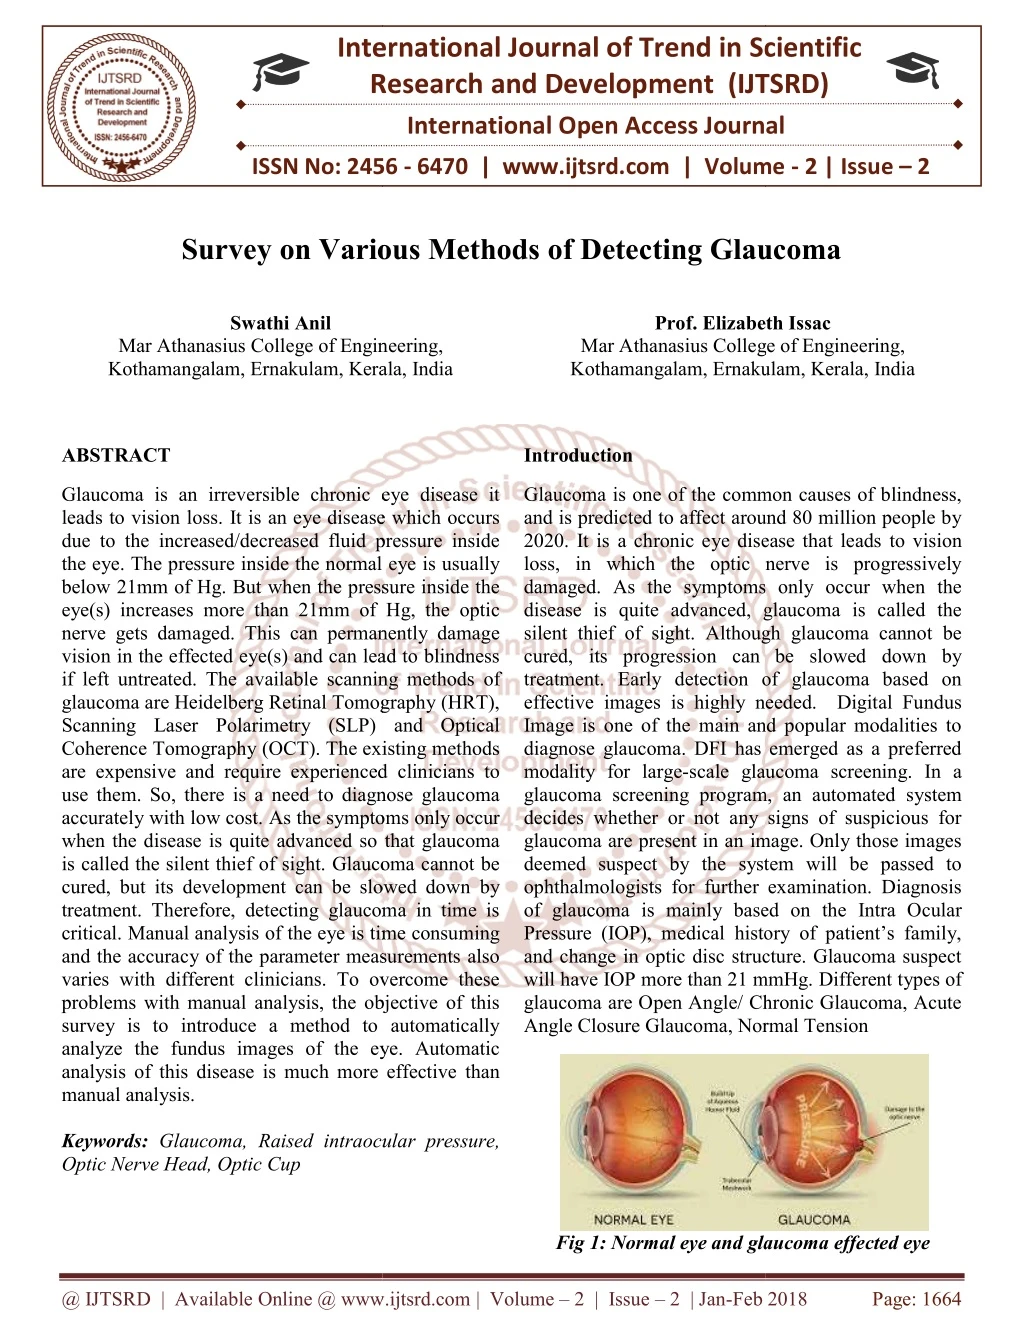
Glaucoma is an irreversible chronic eye disease it leads to vision loss. It is an eye disease which occurs due to the increased decreased fluid pressure inside the eye. The pressure inside the normal eye is usually below 21mm of Hg. But when the pressure inside the eye s increases more than 21mm of Hg, the optic nerve gets damaged. This can permanently damage vision in the effected eye s and can lead to blindness if left untreated. The available scanning methods of glaucoma are Heidelberg Retinal Tomography HRT , Scanning Laser Polarimetry SLP and Optical Coherence Tomography OCT . The existing methods are expensive and require experienced clinicians to use them. So, there is a need to diagnose glaucoma accurately with low cost. As the symptoms only occur when the disease is quite advanced so that glaucoma is called the silent thief of sight. Glaucoma cannot be cured, but its development can be slowed down by treatment. Therefore, detecting glaucoma in time is critical. Manual analysis of the eye is time consuming and the accuracy of the parameter measurements also varies with different clinicians. To overcome these problems with manual analysis, the objective of this survey is to introduce a method to automatically analyze the fundus images of the eye. Automatic analysis of this disease is much more effective than manual analysis. Swathi Anil | Prof. Elizabeth Issac "Survey on Various Methods of Detecting Glaucoma" Published in International Journal of Trend in Scientific Research and Development (ijtsrd), ISSN: 2456-6470, Volume-2 | Issue-2 , February 2018, URL: https://www.ijtsrd.com/papers/ijtsrd10704.pdf Paper URL: http://www.ijtsrd.com/computer-science/bioinformatics/10704/survey-on-various-methods-of-detecting-glaucoma/swathi-anil<br>

E N D
International Research Research and Development (IJTSRD) International Open Access Journal Survey on Various Methods of Detecting Glaucoma Survey on Various Methods of Detecting Glaucoma International Journal of Trend in Scientific Scientific (IJTSRD) International Open Access Journal ISSN No: 2456 ISSN No: 2456 - 6470 | www.ijtsrd.com | Volume 6470 | www.ijtsrd.com | Volume - 2 | Issue – 2 Survey on Various Methods of Detecting Glaucoma Swathi Anil College of Engineering, Prof. Elizabeth Issac Mar Athanasius College of Engineering, Kothamangalam, Ernakulam, Kerala, India Kothamangalam, Ernakulam, Kerala, India Prof. Elizabeth Issac Mar Athanasius College of Engineering, Mar Athanasius College of Engineering, Kothamangalam, Ernakulam, Kerala, India Kothamangalam, Ernakulam, Kerala, India ABSTRACT Introduction Glaucoma is an irreversible chronic eye disease it leads to vision loss. It is an eye disease which occurs due to the increased/decreased fluid pressure inside the eye. The pressure inside the normal eye is usually below 21mm of Hg. But when the pressure inside the eye(s) increases more than 21mm of Hg, the optic nerve gets damaged. This can permanently damage vision in the effected eye(s) and can lead to blindness if left untreated. The available scanning methods glaucoma are Heidelberg Retinal Tomography (HRT), Scanning Laser Polarimetry (SLP) and Optical Coherence Tomography (OCT). The existing methods are expensive and require experienced clinicians to use them. So, there is a need to diagnose glaucoma accurately with low cost. As the symptoms only occur when the disease is quite advanced so that glaucoma is called the silent thief of sight. Glaucoma cannot be cured, but its development can be slowed down by treatment. Therefore, detecting glaucoma in time is critical. Manual analysis of the eye is time consuming and the accuracy of the parameter measurements also varies with different clinicians. To overcome these problems with manual analysis, the objective of this survey is to introduce a method to automatically analyze the fundus images of the eye. Automatic analysis of this disease is much more effective than manual analysis. Keywords: Glaucoma, Raised intraocular pressure Optic Nerve Head, Optic Cup Glaucoma is an irreversible chronic eye disease it It is an eye disease which occurs due to the increased/decreased fluid pressure inside the eye. The pressure inside the normal eye is usually below 21mm of Hg. But when the pressure inside the eye(s) increases more than 21mm of Hg, the optic aged. This can permanently damage vision in the effected eye(s) and can lead to blindness Glaucoma is one of the common causes of blindness, and is predicted to affect around 80 million people by 2020. It is a chronic eye disease that leads to vision loss, in which the optic nerve is progressively damaged. As the symptoms only occur when the disease is quite advanced, glaucoma is called the silent thief of sight. Although glaucoma cannot be cured, its progression can be slowed down by nt. Early detection of glaucoma based on effective images is highly needed. Digital Fundus Image is one of the main and popular modalities to diagnose glaucoma. DFI has emerged as a preferred scale glaucoma screening. In a ening program, an automated system decides whether or not any signs of suspicious for glaucoma are present in an image. Only those images deemed suspect by the system will be passed to ophthalmologists for further examination. Diagnosis ly based on the Intra Ocular Pressure (IOP), medical history of patient’s family, and change in optic disc structure. Glaucoma suspect will have IOP more than 21 mmHg. Different types of glaucoma are Open Angle/ Chronic Glaucoma, Acute Glaucoma is one of the common causes of blindness, and is predicted to affect around 80 million people by 2020. It is a chronic eye disease that leads loss, in which the optic nerve is progressively damaged. As the symptoms only occur when the disease is quite advanced, glaucoma is called the silent thief of sight. Although glaucoma cannot be cured, its progression can be slowed down by treatment. Early detection of glaucoma based on effective images is highly needed. Digital Fundus Image is one of the main and popular modalities to diagnose glaucoma. DFI has emerged as a preferred modality for large-scale glaucoma screening. In a glaucoma screening program, an automated system decides whether or not any signs of suspicious for glaucoma are present in an image. Only those images deemed suspect by the system will be passed to ophthalmologists for further examination. Diagnosis of glaucoma is mainly based on the Intra Ocular Pressure (IOP), medical history of patient’s family, and change in optic disc structure. Glaucoma suspect will have IOP more than 21 mmHg. glaucoma are Open Angle/ Chronic Glaucoma, Acute Angle Closure Glaucoma, Normal Tension ma, Normal Tension e scanning methods of glaucoma are Heidelberg Retinal Tomography (HRT), Scanning Laser Polarimetry (SLP) and Optical phy (OCT). The existing methods are expensive and require experienced clinicians to use them. So, there is a need to diagnose glaucoma As the symptoms only occur when the disease is quite advanced so that glaucoma lent thief of sight. Glaucoma cannot be cured, but its development can be slowed down by treatment. Therefore, detecting glaucoma in time is critical. Manual analysis of the eye is time consuming and the accuracy of the parameter measurements also ith different clinicians. To overcome these problems with manual analysis, the objective of this survey is to introduce a method to automatically analyze the fundus images of the eye. Automatic analysis of this disease is much more effective than Raised intraocular pressure, Fig 1: Normal eye and glaucoma effected eye Normal eye and glaucoma effected eye @ IJTSRD | Available Online @ www.ijtsrd.com @ IJTSRD | Available Online @ www.ijtsrd.com | Volume – 2 | Issue – 2 | Jan-Feb 2018 Feb 2018 Page: 1664
International Journal of Trend in Scientific Research and Development (IJTSRD) ISSN: 2456-6470 `The problem definition is described as to efficiently analyse the fundus images of patients, perform morphological operations, learn from the features extracted and classify them into glaucoma or normal. In objective of this research is to concentrate on the concept of glaucoma detection. Normally eye can be divided as two categories characteristics of eye [1], [2]. 1.Non-Glaucomatic eye (Normal or Healthy eye) 2.Glaucomatic eye In normal healthy eye, the light rays enters to the eye via the cornea, pupil and lens. Those rays are fully focused onto the retina directly, then the light- sensitive tissue are lining the eye backside and retina converts those light rays into some impulses that can sent via the optic nerve to brain, at that time only they are recognized as image [1]. In glaucoma eye, blind spots are developed when the optic nerve fibers can occurred the damage and blind sports are usually unable to detect until optic nerve is damaged. The Early detection and treatment keys to preventing vision loss from glaucoma [2]. In general, Glaucoma occurs as a result of increased intraocular pressure (IOP) caused by a malfunction or malformation on of the eyes drainage system. Normally the eye have 19-21 inches of mercury of IOP [1], [2]. Whereas the compression of retina, progressive and permanent loss of eyesight if left untreated is caused by increased pressure. Glaucoma can be described and characterized by following conditions, 1. Raised intraocular pressure(IOP) 2. Optic Nerve Head(ONH) damage 3. Corresponding loss of visual field DISCUSSION ABOUT RETINAL PART based on their Fig 2. Cross-section of eyes The cornea and sclera outer cover. Cornea covers the anterior surface of the eye and remaining optic globe covered by sclera. The choroid lies directly below the sclera. It has the network of blood vessels that serve as the major source of nutrition to the eye. The retina is the innermost membrane of the eye, which lines the inside of the wall‘s entire posterior portion. The light from an object outside the eye is imaged on the retina. The central portion of the retina is called fovea. B.Retinal Fundus Image The macula, the optic disc, and the blood vessels are the main anatomical features of the retina. A macula in the eye is a small spot where vision is keenest in the retina. The macula of the retina is the light- sensitive layer of tissue at the back of the eye. Blood vessels are the elastic tube or passage in the body through which blood circulates. Fig. 3 shows the color fundus image showing main retinal features. The eye is an organ that reacts to light and has several purposes. It is nearly a sphere, with an average diameter of 20mm. Fig 3: Retinal Fundu image showing main retinal features Optic disc (OD) is one of the main components on retina. It is the location where ganglion cell axons exit the eye to form the optic nerve through which visual information of the photo receptors is transmitted to the brain. It is the small blind spot on the surface of the retina located about 3 mm to the nasal side of the macula. It is only part of the retina that is insensitive A.Anatomy of eye Three membranes enclose the eye. Fig. 2 shows the cross section of the eye. @ IJTSRD | Available Online @ www.ijtsrd.com | Volume – 2 | Issue – 2 | Jan-Feb 2018 Page: 1665
International Journal of Trend in Scientific Research and Development (IJTSRD) ISSN: 2456-6470 to light. It is an indicator of various ophthalmic pathologies. C. Optic Cup The OD can be divided into two distinct zones, namely, a central bright zone called the cup and a peripheral region called the neuro retinal rim where the nerve fibres bend into the cup region. The loss in optic nerve fibres leads to a change in the structural appearance of the OD, namely, the cup region enlargement and thinning of neuroretinal rim called cupping. Cupping is the hallmark of glaucoma which is the visible manifestation of optic nerve head structure. It is an important structural indicator for accessing the presence and progression of glaucoma. The cup region is not necessarily to be in circular, its shape can vary depending upon the shape of eye along with the glaucoma. Finding the cup region helps to detect the Cup-to-Disc Ratio (CDR) which is also an important property for identifying the disease. LITERATURE SURVEY the specific region of the image. This paper mainly proposed the technique of segmentation which is used to segment the optic disc and optic cup in the given retinal image by using the superpixel classification technique [6], [7]. Here the automated optic disc segmentation quality is evaluated by the computation of a self-assessment of reliability score. The proposed segmentation techniques have been evaluated from database images and optic disc and optic cup boundaries are marked by trained peoples. Finally the experiment results are obtained as the error of average overlapping in optic disc and optic cup boundaries are 9.5% and 24.1%. The cup to disc ratio is computed through the segmented optic disc and optic cup for glaucoma screening [6]. Fig.4. represents superpixels based segmentation, in which each image is divided as superpixels, and the features are measured to classify the superpixel as disc or non-disc [7]. In this section, we present some of the most suitable techniques that are used for the detection of glaucoma. There are manual and automatic detection methods available. The survey is conducted on different glaucoma detection methods in image processing. Fig. 4. Superpixel based optic disc segmentation. C.Segmentation of optic disk and cup from monocular color retinal images This paper presents about the assessment of glaucoma from monocular color retinal images done by Optic Disk and Cup Segmentation [8], [11]. Contour model method which is used to segment the OD cup based on anatomical evidence like vessel bends at the boundary of cup [9], [10]. A.Sparse Dissimilarity Constrained Coding for Glaucoma Screening This paper presents about compute the CDR using the method of Sparse Dissimilarity-Constrained Coding (SDC) to locate and segment the disc from the image. The location of disc is finding approximately and sometimes very often to the disc which is based on their anatomical structures and brightness among the macula, blood vessels of retina and those anatomical structures [4]. In this paper, they proposed the self- assessment disc segmentation method of state-of-the art is used. It gives more accurate result of screening the glaucoma in retinal fundus image. B.Superpixel classification based segmentation of optic disc and optic cup The superpixel classification is a technique to classify the image based on their category as well as segment Fig. 5. Normal retina with Vessel bends inside OD @ IJTSRD | Available Online @ www.ijtsrd.com | Volume – 2 | Issue – 2 | Jan-Feb 2018 Page: 1666
International Journal of Trend in Scientific Research and Development (IJTSRD) ISSN: 2456-6470 Cup to Disc Ratio (CDR), area of Nero Retinal Rim (NRR) and different regions of blood vessels which is used as features and give as inputs to the learning algorithm for diagnosis of glaucoma. F.Angle open distance 500 calculation by using GUL Glaucoma can be detected using an algorithm that automatically performs angle calculation by analyzing the eye ultrasound images. The algorithm reduce the processing time taken by the manual compute based algorithm without compromising on the speed, accuracy, sensitivity, cost and compatibility of the product with relevance of image processing concepts. To avoid the problems in image like noise, poor resolution, the following three step method is used. i) Step-1: Ultrasound image processing It includes the steps thresholding median filtering, erosion and hole filling to curate fine image. ii) Step--2: Segmentation of the processed image Classification of various region of ultra sound image, eliminating the unwanted image, cropping the anterior chamber region and the location of reference axis these are the effective procedures for segmentation. iii) Step--3: Calculation of AOD 500. It involves steps like masking determination of apex point (X apex, Y apex) location, tracing anterior chamber, AOD algorithm is able to correctly diagnose glaucoma in 97% of the cases. G.Cup to disk ratio Various segmentation and classification techniques are used to detect the glaucoma from the retinal images based on the Cup to Disc Ratio (CDR) evaluation of pre-processed image. In paper [2] it presents an image processing segmentation of optic disc and cup as well as diagnosis of glaucoma using the features obtained from the image based on the study of adaptive thresholding technique and SVM classification technique. It includes mainly 3 steps. They are Region of Interest (ROI) Extraction, Feature extraction stage and classification stage. The K means clustering technique is recursively applied to extract the optic disc and optic cup region and an elliptical fitting technique is applied to find the CDR values. The blood vessels in the optic disc region are detected by Fig. 6. Abnormal retina with no vessel bends inside OD They don’t have proper blood vessel bends in the retina shown in Fig. 6., thus it can unable to process with abnormal retina. Most of the glaucomatous OD Cup will have anomalous blood vessels [11]. D.Segmenting the Optic Disc in Retinal images using Adaptive Thresholding This paper presents automatic approach for segment the optic disc in retinal fundus image using adaptive thresholding technique and boundary extraction. Here the retinal images are converted into grayscale image and the image enhancement is done by histogram equalization [5], [12]. The segmentation is done by using adaptive thresholding technique and the optical disk is extracted by morphological operators. It gives more efficient segmentation process which is compared by others [12]. like, enhancement, 500 calculations. This Fig. 7. Results of segmented optical disc after the thresholding a) left column are input image, b) right column is threshold image E.An adaptive threshold based image processing technique This paper presents about detection of glaucoma from the retinal fundus images which based on an automatic image processing method. In this paper learning algorithm is used that can obtain the input image from following manner to glaucoma diagnosis. Glaucoma infections discriminatory parameters like technique for @ IJTSRD | Available Online @ www.ijtsrd.com | Volume – 2 | Issue – 2 | Jan-Feb 2018 Page: 1667
International Journal of Trend in Scientific Research and Development (IJTSRD) ISSN: 2456-6470 J.Texture and higher order spectra features Two types of features are extracted after pre- processing:1) HOS parameters and 2) texture descriptors. HOS represents both amplitude and phase information of a signal. HOS can be used for both deterministic signals and random processes. This method is clinically significant because these features had a low p-value, which means that there is more chance that these features have very different values for the normal and abnormal classes and better discriminate the two classes[5]. Random-forest classifier, combined with z-score normalization and feature-selection methods are used for classification purpose. K.Neural networks ad adaptive neuron fuzzy inference system A classifier based on Neural Network and Adaptive Fuzzy Inference system (ANFIS)[6] is used. It utilizes both delta rule and back propagation algorithm. ANFIS combines the capabilities of fuzzy inference algorithms and neural networks. An adaptive neural network is a structure consists of five layers and a number of nodes connected via links. First layer perform fuzzification, second layer executes the fuzzy AND of the antecedent part of the fuzzy rules, the third layer normalizes the fuzzy membership functions, the fourth layer executes the consequent part of the fuzzy rules and finally the last layer computes the output of the fuzzy system by summing up the outputs of the fourth layer. ANFIS is a multilayer feed forward network which uses ANN learning algorithms and characterize an input space to an output. L.Gabor transform Image features can be extracted by applying Gabor transform on fundus images. Gabor transform is a version of short time Fourier transforms. It is used to determine the sinusoidal frequency and phase content of local sections of a signal as it changes over time. Various features namely mean, variance, skewness, kurtosis, energy, and Shannon, Renyi, and Kapoor entropies are extracted from the Gabor transform coefficients. These extracted features are subjected to principal component analysis (PCA) to reduce the dimensionality of the features. Then the features are ranked using various Bhattachaiyya space algorithm, t-test, Wilcoxon test, etc.. But t-test ranking method yielded the highest using local entropy thresholding approach. The ratio of area of blood vessels in the inferior-superior side to area of blood vessels in the nasal-temporal side (ISNT) is combined with the CDR for the classification of fundus image as normal or glaucoma by using Support Vector Machine .It gives accuracy improvement and sensitivity of detection of glaucoma from retinal fundus image. H.Wavelet based energy features In wavelet transform (WT), the image is represented in terms of the frequency of content of local regions over a range of scales. Data is initially subjected to standard histogram equalization. Then the discrete wavelet transform features are extracted and pre- processed. Then the features are normalized using z- score normalization technique. These features are then ranked using chi squared ([χ2]), gain ratio, information gain feature evaluation techniques and relief feature ranking schemes. Then the features are selected using four consistency subset evaluation strategies: best first, random search, genetic search and greedy search. I.Principal component analysis, fast Fourier transform & spline In this paper [4] it uses a 3 step procedure for automatic detection of glaucoma. The steps are Pre- processing, Feature extraction and Classification. Pre- processing involves illumination correction, vessel removal and optic nerve head normalization. The high-dimensional pre-processed statistically compressed Component Analysis) to meaningful features ‘f’. To capture complementary image information three different generic image representations is used with different spatial and frequency resolution for feature extraction. They are Pixel intensity values, B-spline coefficients and FFT coefficients. SVM classifier is used here for classification. Here a 2 stage classification scheme combines the features to find out the glaucoma risk index (GRI). First stage involves the determination of probability for normalized PCA compressed features. Second stage includes the concatenation of the probabilities to one low dimensional feature space. The GRI obtained provide an accuracy of 80% in a two class problem. images PCA gain P are fuzzy reasoning to by (Principal compact and ranking methods like @ IJTSRD | Available Online @ www.ijtsrd.com | Volume – 2 | Issue – 2 | Jan-Feb 2018 Page: 1668
International Journal of Trend in Scientific Research and Development (IJTSRD) ISSN: 2456-6470 performance with an average accuracy of 93.10%, sensitivity of 89.75% and specificity of 96.20% using 23 features with Support Vector Machine (SVM) classifier. M.2D EWT and Correntropy R,G,B components and gray scale values are extracted first [7]. Then R,G,B values are subjected to 2D empirical wavelet transform to form sub-band images. EWT is an adaptive method of signal decomposition. Band pass filters defined on each contiguous segment defines empirical wavelets. Then the correntropy is extracted from decomposed components. Correntropy is a non-linear kernelized similarity measure. Then the features showing distinction are selected using Student’s t-test algorithm. Then the features are standardized with zero mean and unit standard deviation. The process is known as z-score normalization. The ranked features are classified using the Least Squares Support Vector Machine (LS- SVM) classifier with kernels such as Radial Basis Function (RBF), Morlet wavelet and Mexican-hat wavelet. Advantages of the this method are: Obtained a sensitivity of 100%, Reported high performance using three-fold and ten-fold cross validation, Used less number of features to obtain highest classification accuracy, Performance of the system does not depend on the resolution of the image. N.Glaucoma detection using Deep Convolution Neural Network Glaucoma is a chronic and irreversible eye disease, which leads to deterioration in vision and quality of life. In this paper, we develop a deep learning (DL) architecture with convolutional neural network for automated glaucoma diagnosis. Deep learning systems, such as convolutional neural networks (CNNs), can infer a hierarchical representation of images to discriminate between glaucoma and non- glaucoma patterns for diagnostic decisions. The proposed DL architecture contains six learned layers: four convolutional layers and two fully-connected layers. Dropout and data augmentation strategies are adopted to further boost the performance of glaucoma diagnosis. Extensive experiments are performed on the ORIGA and SCES datasets. The results show area under curve (AUC) of the receiver operating characteristic curve in glaucoma detection at 0.831 and 0.887 in the two databases, much better than state-of-the-art algorithms. The method could be used for glaucoma detection. CONCLUSION Glaucoma is a silent disease that comes with no symptoms and warning. Initially no one can say that the patient is having any sort of problem either by looking and touching the eye. Hence its detection and diagnosis are very essential. We have present literature survey of some papers about the detection of glaucoma in 2D fundus retinal images with using several techniques. Here we have work with some segmentation and classification technique to segment the optic disc and classifies the image based on their feature selection of the image. According to the results obtained, we conclude that the Deep convolution neural network technique is best for segment the specific region under curve (AUC) of the receiver operating characteristic curve in glaucoma detection [13], as well as SVM classifier is best for classifies the image based upon their category [4].These two techniques are very helpful to ophthalmologist to glaucoma assessment as efficient manner. REFERENCES 1.S. Y. Shen, “The prevalence and types of glaucoma in Malay people: The Singapore Malay eye study,” Investigative Ophthalmol. Vis. Sci., vol. 49, no. 9, pp. 3846–3851, 2008. 2.H. A. Quigley and A. T. Broman, “The number of people with glaucoma worldwide in 2010 and 2020,” Brit. J. Ophthalmol., vol. 90, no. 3, pp. 262–267, 2006. 3.Istvan Lazar “Retinal Microaneurysm Detection Through Local Rotating Cross-Section Profile Analysis”, IEEE MEDICAL IMAGING, VOL. 32, NO. 2, FEBRUARY 2013 . 4.Jun Cheng, Fengshou Yin, Damon Wing Kee Wong,” Sparse Dissimilarity-Constrained Coding for Glaucoma TRANSACTIONS ENGINEERING, VOL. 62, NO. 5, MAY 2015 5.M. Foracchia et al., “Detection of optic disc in retinal images by means of a geometrical model of vessel structure” ,IEEE Trans. Med. Imag., vol. 23, no. 10, pp. 1189–1195, Oct. 2004. 6.J. Cheng et al., “Superpixel classification based optic disc and optic cup segmentation for TRANSACTIONS ON Screening”, ON IEEE BIOMEDICAL @ IJTSRD | Available Online @ www.ijtsrd.com | Volume – 2 | Issue – 2 | Jan-Feb 2018 Page: 1669
International Journal of Trend in Scientific Research and Development (IJTSRD) ISSN: 2456-6470 glaucoma screening ”, IEEE Trans. Med. Imag., vol. 32, no. 6, pp. 1019–1032, Jun. 2013 7.J. Meier et al., “Effects of preprocessing eye fundus images on appearance based glaucoma classification”, in Proc. 12th Int. Conf. Comput. Anal. Images Patterns, 2007, pp. 165–172 8.R. Bock et al., “Classifying glaucoma with image- based features from fundus photographs”, in Proc. Annu. Pattern Recog. Symp. German Assoc. Pattern Recog., 2007, pp. 355–364. 9.G. D. Joshi et al., “Optic disk and cup boundary detection using regional information”, in Proc. IEEE Int. Symp. Biomed. Imag., 2010, pp. 948– 951. 10.M. D. Abramoff et al., “Retinal imaging and image analysis”, IEEE Trans. Med. Imag., vol. 3, no. 9, pp. 169–208, Jan. 2010 11.G. D. Joshi et al., “Optic disk and cup segmentation from monocular color retinal images for glaucoma assessment” , IEEE Trans. Med. Imag., vol. 30, no. 6, pp. 1192–1205, Jun. 2011 12. F.Yin et al., “Automated segmentation of optic disc and optic cup in fundus images for glaucoma diagnosis”, in Proc. IEEE Int. Symp. Comput.- Based Med. Syst., 2012, pp. 1–6 13.Prashant Choukikar, “Segmenting the Optic Disc in Retinal images using Thresholding”, International Journal of Computer Applications (0975-8887), Vol 94-No 11,May 2014 14.Issac A, Partha Sarathi M, Dutta MK. “An adaptive threshold based image processing technique for improved glaucoma detection and classification”, Comput. Biomed, 2015 Aug 10. 15.Neelapala Anil Kumar and P.A.Nageswara Rao, Prof P.Mallikarjuna Rao, Smt. M. Satya Anuradha: “Automatic detection of glaucoma in eye by angle opens distance 500 calculation by using GUI”, International Journal of Science and Advanced Technology (ISSN 2221-8386) Volume 1 No 6 August 2011. 16.K.Narasimhan, Dr.K.Vijayarekha: “An efficient automated system for glaucoma detection using fundus image”, Journal of Theoretical and Applied Information Technology, 15th November 2011. Vol. 33 No.1. 17.Sumeet Dua, Senior Member, IEEE, U. Rajendra Acharya, Pradeep Chowriappa, Member, IEEE, and S. Vinitha Sree, ‘Wavelet-Based Energy Features for Glaucomatous Image Classification”, IEEE Transactions on Information Technology in Biomedicine, Vol. 16, No. 1, January 2012. 18.R. Bock, J. Meier, L. G. Ny´ul, J. Hornegger, and G. Michelson, “Glaucoma risk index: Automated glaucoma detection from color fundus images,” Medical Image Analysis, vol. 14, no. 3, pp. 471– 481, 2010. 19.U. Rajendra Acharya, Sumeet Dua, Xian Du, Vinitha Sree S, and Chua Kuang Chua, “Automated Diagnosis of Glaucoma Using Texture and Higher Order Spectra Features”, ”, IEEE Transactions on Information Technology in Biomedicine Vol. 15, No: 3, May 2011. 20.Rohan Appasaheb Borgalli, Hari Pratap Gautam , Winner George Parayil, “Automated Glaucoma Detection Techniques Using Fundus Image”, International Journal Enhancements and Research, Vol 3, Issue 12. 21.Shishir Maheshwari, Ram Bilas Pachori, and U. Rajendra Acharya, “Automated Diagnosis of Glaucoma Using Empirical Wavelet Transform and Correntropy Features Extracted from Fundus Images”, IEEE Journal of Biomedical and Health Informatics,2016. 22.Joshi GD, Sivaswamy J,Krishnadas SR “Optic disk and cup segmentation from monocular color retinal images for glaucoma assessment,”. IEEE Trans. Med. Imag., vol. 30, no. 6, pp. 1192– 1205,Jun. 2011. 23.S. Chandrika 1, K. Nirmala 2 “Analysis of CDR Detection for Glaucoma Diagnosis,” (IJERA) ISSN: 2248-9622 National Conference on Advanced communication Techniques (NCACCT-19 March 2013. 24.Screening Jun Cheng, Ngan-Meng Tan,Ching-Yu Cheng, Tin Aung, and Tien Yin Wong “Superpixel Classification Based Optic Disc and Optic Cup Segmentation for Glaucoma,” IEEE TRANSACTIONS ON MEDICAL IMAGING, VOL. 32 NO. 6, JUNE 2013. 25. Subi. P .P “Glaucoma screening based on superpixel classification and detection of macula in human retinal imagery,” IJCAT International Journal of Computing and Technology, Volume 1, Issue 5, June 2014. 26.R. Bock, J. Meier, L. G. Nyl, and G. Michelson, “Glaucoma risk index: Automated glaucoma detection from color fundus images,”Med. Image Anal., vol. 14, pp. 471–481, 2010.2007. 27.Saja Usman1, Dimple Shajahan “A REVIEW ON DIFFERENT GLAUCOMA of Technology Engineering Emerging Arun Kumar Patel, Methods Programs & Computing DETECTION @ IJTSRD | Available Online @ www.ijtsrd.com | Volume – 2 | Issue – 2 | Jan-Feb 2018 Page: 1670
International Journal of Trend in Scientific Research and Development (IJTSRD) ISSN: 2456-6470 METHODS,” International Journal of Advanced Research in Engineering Technology (IJARET), ISSN 0976 – 6499 Volume 5, Issue 2, February (2014), pp. 95-100. 28.Chalinee Burana-Anusorn, KanokvateTungpimolrut Processing Techniques for Glaucoma Detection Using the Cupto- Disc Ratio,” International Journal of Science and Technology, Vol. 18, No. 1, January-March 2013. 29.S.Kavitha1, K.Duraiswamy Glaucoma Screening Using CDR From 2D Fundus Images Glaucoma in fundus images using ANFIS,” Jan 2012. and Thammasat “Image “Automated @ IJTSRD | Available Online @ www.ijtsrd.com | Volume – 2 | Issue – 2 | Jan-Feb 2018 Page: 1671