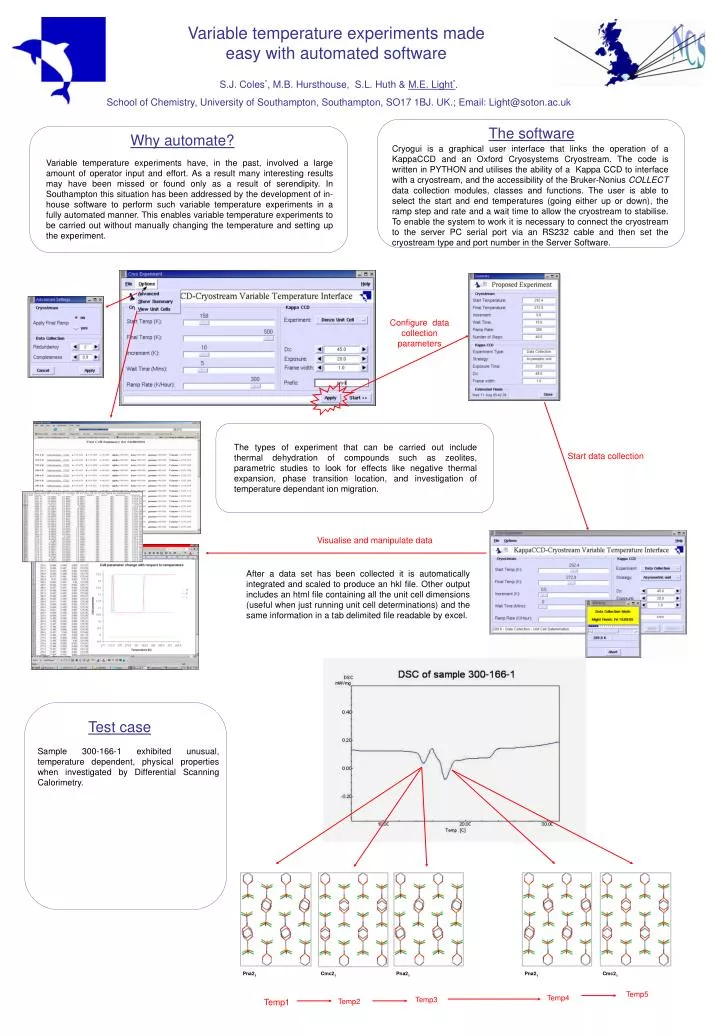
School Management Software Made Easy Skugal
WHAT IS THE BEST SCHOOL MANAGEMENT SOFTWARE? In the previous article, we read about how the school management software work does. Now, in this article we will read about What is the Best School Management Software. Technology is at its peak in todayu2019s era and each school is trying to imbibe the best technological facilities that are available for better and efficient functioning of their schools. Quite a number of school management technology softwares are available in the market. All of them try to provide more or less the same functionalities. But to manage a robust and reputed school in cities like Delhi and Noida, it needs the UNPARALLED. Nothing can be compromised if we need to put out the best for our students and their welfare. That is why u2018SkuGal School Management Softwareu2019 is the best software available at present. It caters to the following aspects:- 1.t iAttendance- For every student, attending the classes regularly is extremely important to widen their horizon and to learn in general. This features of SkuGal software helps the teachers upload their studentsu2019 attendance .It especially comes in useful when the school is based on boarding pattern 2.tiTracking- This is another useful feature in SkuGal software which keeps a track on the childu2019s location and sends GPS real time location to the parents as well for their safety and security. This feature also informs the parents and school authorities about the driveru2019s speed, fuel report and double checks whether the child has reached home/ school safely in time or not. Likewise, other ERP companies like Next.ERP, EduXpert, MasterSoft does have this feature, but Skugal is the most user friendly app to use. 3.tiNotify- This feature is one of the most important component which gives the parents a regular update regarding the fees payment, or any parent- teachers meeting notice, birthday wishes from the school, complaints against their ward, details of exam schedules etc. This is a feature which not many companies provide like Focus, ZeroERP, MasterSoft provide you with such accessibility other than SkuGal. 4.tiProfiling- This attribute in SkuGal gives a complete profile about the childu2019s reports, behavior in class etc. so that the parents are well-informed about their childu2019s learning levels at school. In this highly competitive world, competing at par with excellence is extremely fundamental. This feature avails just the same for students to improve and get guided by their mentors. This is a common feature present in all other companies like Next.ERP, EduMarshal, EduXpert, Skolaro, Capterra,ZeroERP and MasterSoft. 5.tiManage- This feature helps manage the cardinal details of a student by just one click like their achievements or other important notices from the school. This feature is also present in all the other companies. 6.tiPayment- This is another essential feature which helps transfer the fees safely without getting into loads of paperwork, also present in all companies modules. But, amongst all these companies, the reason why we are recommending SkuGal is because its free of cost and its unique user-friendly features is helpful to all ages across. Therefore, why to wait?? Experience the new world of SkuGal in your palms!! In the previous article, we read about how the school management software work does. Now, in this article, we will read about What is the Best School Management Software. Technology is at its peak in todayu2019s era and each school is trying to imbibe the best technological facilities that are available for the better and efficient functioning of their schools. Quite a number of school management technology software are available in the market. All of them try to provide more or less the same functionalities. But to manage a robust and reputed school in cities like Delhi and Noida, it needs UNPARALLELED. Nothing can be compromised if we need to put out the best for our students and their welfare. That is why u2018SkuGal School Management Softwareu2019 is the best software available at present. It caters to the following aspects:- iAttendance- For every student, attending the classes regularly is extremely important to widen their horizons and to learn in general. These features of SkuGal software helps the teachers upload their studentsu2019 attendance. It especially comes in useful when the school is based onboarding pattern iTracking- This is another useful feature in SkuGal Bus Tracking System software which keeps track of the childu2019s location and sends GPS real-time location to the parents as well for their safety and security. This feature also informs the parents and school authorities about the driveru2019s speed, fuel report and double-checks whether the child has reached home/ school safely in time or not. Skugal is the most user-friendly app to use. iNotify- This feature is one of the most important components which gives the parents a regular update regarding the fees payment, or any parent-teachers meeting notice, birthday wishes from the school, complaints against their ward, details of exam schedules, etc. iProfiling- This attribute in SkuGal gives a complete profile about the childu2019s reports, behavior in class, etc. so that the parents are well-informed about their childu2019s learning levels at school. In this highly competitive world, competing at par with excellence is extremely fundamental. This feature avails just the same for students to improve and get guided by their mentors. iManage- This feature helps manage the cardinal details of a student by just one click like their achievements or other important notices from the school. This feature is also present in all the other companies. iPayment- This is another essential feature that helps transfer the fees safely without getting into loads of paperwork, also present in all companies' modules. But, amongst all these companies, the reason why we are recommending SkuGal is that its free of cost and its unique user-friendly features are helpful to all ages across. Therefore, why to wait?? Experience the new world of SkuGal in your palms!!
68 views • 6 slides