Download
1 / 45
490 likes | 761 Vues
Chapter 24 Project Scheduling and Tracking. Software Engineering: A Practitioner’s Approach, 6th edition by Roger S. Pressman. Why Are Projects Late?. an unrealistic deadline established by someone outside the software development group

E N D
Chapter 24Project Scheduling and Tracking Software Engineering: A Practitioner’s Approach, 6th edition by Roger S. Pressman
Why Are Projects Late? • an unrealistic deadline established by someone outside the software development group • changing customer requirements that are not reflected in schedule changes; • an honest underestimate of the amount of effort and/or the number of resources that will be required to do the job; • predictable and/or unpredictable risks that were not considered when the project commenced; • technical difficulties that could not have been foreseen in advance; • human difficulties that could not have been foreseen in advance; • miscommunication among project staff that results in delays; • a failure by project management to recognize that the project is falling behind schedule and a lack of action to correct the problem
Your Response per Napoleon • “Any commander in chief [software engineering manager] who undertakes to carry out a plan which he considers defective is at fault; he must put forth his reasons, insist on the plan being changed, and finally tender his resignation rather than be the instrument of his army’s [project team’s] downfall.”
How to Change an Unrealistic Deadline • Perform a detailed estimate of effort and time using historical data • Using an incremental process model, develop a strategy to deliver critical functionality by the deadline – document the plan • Meet with the customer and explain why the • Offer the incremental development strategy as an alternative
Scheduling Principles • compartmentalization—define distinct tasks • interdependency—indicate task interrelationship • effort validation—be sure resources are available • defined responsibilities—people must be assigned • defined outcomes—each task must have an output • defined milestones—review for quality
Empirical Relationship: P vs E Given Putnam’s Software Equation (5-3), E = L3 / (P3t4) Consider a project estimated at 33 KLOC, 12 person-years of effort, with a P of 10K, the completion time would be 1.3 years If deadline can be extended to 1.75 years, E = L3 / (P3t4) ≈ 3.8 p-years vs 12 p-years
Effort Allocation • “front end” activities • customer communication • analysis • design • review and modification • construction activities • coding or code generation • testing and installation • unit, integration • white-box, black box • regression 40-50% 15-20% 30-40%
Defining Task Sets • determine type of project • concept development, new application development, application enhancement, application maintenance, and reengineering projects • assess the degree of rigor required • identify adaptation criteria • select appropriate software engineering tasks
Task Set Refinement 1.1 Concept scoping determines the overall scope of the project. • Task definition: Task 1.1 Concept Scoping • 1.1.1 Identify need, benefits and potential customers; • 1.1.2 Define desired output/control and input events that drive the application; • Begin Task 1.1.2 • 1.1.2.1 FTR: Review written description of need • FTR indicates that a formal technical review (Chapter 26) is to be conducted. • 1.1.2.2 Derive a list of customer visible outputs/inputs • 1.1.2.3 FTR: Review outputs/inputs with customer and revise as required; • endtask Task 1.1.2 • 1.1.3 Define the functionality/behavior for each major function; • Begin Task 1.1.3 • 1.1.3.1 FTR: Review output and input data objects derived in task 1.1.2; • 1.1.3.2 Derive a model of functions/behaviors; • 1.1.3.3 FTR: Review functions/behaviors with customer and revise as required; • endtask Task 1.1.3 • 1.1.4 Isolate those elements of the technology to be implemented in software; • 1.1.5 Research availability of existing software; • 1.1.6 Define technical feasibility; • 1.1.7 Make quick estimate of size; • 1.1.8 Create a Scope Definition; • endTask definition: Task 1.1 is refined to
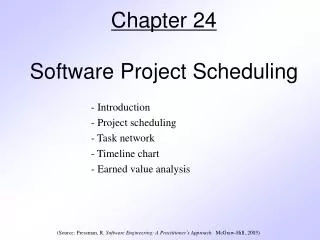
Timeline Charts Tasks Week 1 Week 4 Week 3 Week n Week 2 Task 1 Task 2 Task 3 Task 4 Task 5 Task 6 Task 7 Task 8 Task 9 Task 10 Task 11 Task 12
Schedule Tracking • conduct periodic project status meetings in which each team member reports progress and problems. • evaluate the results of all reviews conducted throughout the software engineering process. • determine whether formal project milestones (diamonds in previous slide) have been accomplished by the scheduled date. • compare actual start-date to planned start-date for each project task listed in the resource table • meet informally with practitioners to obtain their subjective assessment of progress to date and problems on the horizon. • use earned value analysis to assess progress quantitatively.
Progress on an OO Project-I • Technical milestone: OO analysis completed • All classes and the class hierarchy have been defined and reviewed. • Class attributes and operations associated with a class have been defined and reviewed. • Class relationships (Chapter 8) have been established and reviewed. • A behavioral model (Chapter 8) has been created and reviewed. • Reusable classes have been noted. • Technical milestone: OO design completed • The set of subsystems (Chapter 9) has been defined and reviewed. • Classes are allocated to subsystems and reviewed. • Task allocation has been established and reviewed. • Responsibilities and collaborations (Chapter 9) have been identified. • Attributes and operations have been designed and reviewed. • The communication model has been created and reviewed.
Progress on an OO Project-II • Technical milestone: OO programming completed • Each new class has been implemented in code from the design model. • Extracted classes (from a reuse library) have been implemented. • Prototype or increment has been built. • Technical milestone: OO testing • The correctness and completeness of OO analysis and design models has been reviewed. • A class-responsibility-collaboration network (Chapter 8) has been developed and reviewed. • Test cases are designed and class-level tests (Chapter 14) have been conducted for each class. • Test cases are designed and cluster testing (Chapter 14) is completed and the classes are integrated. • System level tests have been completed.
Earned Value Analysis (EVA) • Earned value • is a measure of progress • enables us to assess the “percent of completeness” of a project using quantitative analysis rather than rely on a gut feeling • “provides accurate and reliable readings of performance from as early as 15 percent into the project.” [FLE98]
Computing Earned Value-I • The budgeted cost of work scheduled (BCWS) is determined for each work task represented in the schedule. • BCWSi is the effort planned for work task i. • To determine progress at a given point along the project schedule, the value of BCWS is the sum of the BCWSi values for all work tasks that should have been completed by that point in time on the project schedule. • The BCWS values for all work tasks are summed to derive the budget at completion, BAC. Hence, • BAC = ∑ (BCWSk) for all tasks k
Computing Earned Value-II • Next, the value for budgeted cost of work performed (BCWP) is computed. • The value for BCWP is the sum of the BCWS values for all work tasks that have actually been completed by a point in time on the project schedule. • “the distinction between the BCWS and the BCWP is that the former represents the budget of the activities that were planned to be completed and the latter represents the budget of the activities that actually were completed.” [WIL99] • Given values for BCWS, BAC, and BCWP, important progress indicators can be computed: • Schedule performance index, SPI = BCWP/BCWS • Schedule variance, SV = BCWP – BCWS • SPI is an indication of the efficiency with which the project is utilizing scheduled resources.
Computing Earned Value-III • Percent scheduled for completion = BCWS/BAC • provides an indication of the percentage of work that should have been completed by time t. • Percent complete = BCWP/BAC • provides a quantitative indication of the percent of completeness of the project at a given point in time, t. • Actual cost of work performed, ACWP, is the sum of the effort actually expended on work tasks that have been completed by a point in time on the project schedule. It is then possible to compute • Cost performance index, CPI = BCWP/ACWP • Cost variance, CV = BCWP – ACWP
Problem 24.12 Assume you are a software project manager and that you’ve been asked to computer earned value statistics for a small software project. The project has 56 planned work tasks that are estimated to require 582 person-days to complete. At the time that you’ve been asked to do the earned value analysis, 12 tasks have been completed. However, the project schedule indicates that 15 tasks should have been completed. The following scheduling data (in person-days) are available:
Task Planned Effort Actual Effort 1 12 12.5 2 15 11 3 13 17 4 8 9.5 5 9.5 9.0 6 18 19 7 10 10 8 4 4.5 9 12 10 10 6 6.5 11 5 4 12 14 14.5 13 16 14 6 15 8 Compute the SPI, schedule variance, percent scheduled for completion, percent complete, CPI, and cost variance for the project.
Chapter 25Risk Management Software Engineering: A Practitioner’s Approach, 6th edition by Roger S. Pressman
Project Risks What can go wrong? What is the likelihood? What will the damage be? What can we do about it?
Reactive Risk Management • project team reacts to risks when they occur • mitigation—plan for additional resources in anticipation of fire fighting • fix on failure—resource are found and applied when the risk strikes • crisis management—failure does not respond to applied resources and project is in jeopardy
Proactive Risk Management • formal risk analysis is performed • organization corrects the root causes of risk • TQM concepts and statistical SQA • examining risk sources that lie beyond the bounds of the software • developing the skill to manage change
Seven Principles • Maintain a global perspective—view software risks within the context of system and the business problem • Take a forward-looking view—think about the risks that may arise in the future; establish contingency plans • Encourage open communication—if someone states a potential risk, don’t discount it. • Integrate—a consideration of risk must be integrated into the software process • Emphasize a continuous process—the team must be vigilant throughout the software process, modifying identified risks as more information is known and adding new ones as better insight is achieved. • Develop a shared product vision—if all stakeholders share the same vision of the software, it likely that better risk identification and assessment will occur. • Encourage teamwork—the talents, skills and knowledge of all stakeholder should be pooled
Risk Management Paradigm control track RISK identify plan analyze
Risk Identification • Product size—risks associated with the overall size of the software to be built or modified. • Business impact—risks associated with constraints imposed by management or the marketplace. • Customer characteristics—risks associated with the sophistication of the customer and the developer's ability to communicate with the customer in a timely manner. • Process definition—risks associated with the degree to which the software process has been defined and is followed by the development organization. • Development environment—risks associated with the availability and quality of the tools to be used to build the product. • Technology to be built—risks associated with the complexity of the system to be built and the "newness" of the technology that is packaged by the system. • Staff size and experience—risks associated with the overall technical and project experience of the software engineers who will do the work.
Assessing Project Risk-I • Have top software and customer managers formally committed to support the project? • Are end-users enthusiastically committed to the project and the system/product to be built? • Are requirements fully understood by the software engineering team and their customers? • Have customers been involved fully in the definition of requirements? • Do end-users have realistic expectations?
Assessing Project Risk-II • Is project scope stable? • Does the software engineering team have the right mix of skills? • Are project requirements stable? • Does the project team have experience with the technology to be implemented? • Is the number of people on the project team adequate to do the job? • Do all customer/user constituencies agree on the importance of the project and on the requirements for the system/product to be built?
Risk Components • performance risk—the degree of uncertainty that the product will meet its requirements and be fit for its intended use. • cost risk—the degree of uncertainty that the project budget will be maintained. • support risk—the degree of uncertainty that the resultant software will be easy to correct, adapt, and enhance. • schedule risk—the degree of uncertainty that the project schedule will be maintained and that the product will be delivered on time.
Risk Projection • Risk projection, also called risk estimation, attempts to rate each risk in two ways • the likelihood or probability that the risk is real • the consequences of the problems associated with the risk, should it occur. • The are four risk projection steps: • establish a scale that reflects the perceived likelihood of a risk • delineate the consequences of the risk • estimate the impact of the risk on the project and the product, • note the overall accuracy of the risk projection so that there will be no misunderstandings.
Building a Risk Table Risk Probability Impact RMMM Risk Mitigation Monitoring & Management
Building the Risk Table • Estimate the probability of occurrence • Estimate the impact on the project on a scale of 1 to 5, where • 1 = low impact on project success • 5 = catastrophic impact on project success • sort the table by probability and impact
Risk Exposure (Impact) The overall risk exposure, RE, is determined using the following relationship [HAL98]: RE = P x C where P is the probability of occurrence for a risk, and C is the cost to the project should the risk occur.
Risk Exposure Example • Risk identification. Only 70 percent of the software components scheduled for reuse will, in fact, be integrated into the application. The remaining functionality will have to be custom developed. • Risk probability. 80% (likely). • Risk impact. 60 reusable software components were planned. If only 70 percent can be used, 18 components would have to be developed from scratch (in addition to other custom software that has been scheduled for development). Since the average component is 100 LOC and local data indicate that the software engineering cost for each LOC is $14.00, the overall cost (impact) to develop the components would be 18 x 100 x 14 = $25,200. • Risk exposure. RE = 0.80 x 25,200 ~ $20,200.
Risk Mitigation, Monitoring,and Management • mitigation—how can we avoid the risk? • monitoring—what factors can we track that will enable us to determine if the risk is becoming more or less likely? • management—what contingency plans do we have if the risk becomes a reality?
Risk Due to Product Size Attributes that affect risk: • estimated size of the product in LOC or FP? • estimated size of product in number of programs, files, transactions? • percentage deviation in size of product from average for previous products? • size of database created or used by the product? • number of users of the product? • number of projected changes to the requirements for the product? before delivery? after delivery? • amount of reused software?
Risk Due to Business Impact Attributes that affect risk: • affect of this product on company revenue? • visibility of this product by senior management? • reasonableness of delivery deadline? • number of customers who will use this product • interoperability constraints • sophistication of end users? • amount and quality of product documentation that must be produced and delivered to the customer? • governmental constraints • costs associated with late delivery? • costs associated with a defective product?
Risks Due to the Customer Questions that must be answered: • Have you worked with the customer in the past? • Does the customer have a solid idea of requirements? • Has the customer agreed to spend time with you? • Is the customer willing to participate in reviews? • Is the customer technically sophisticated? • Is the customer willing to let your people do their job—that is, will the customer resist looking over your shoulder during technically detailed work? • Does the customer understand the software engineering process?
Risks Due to Process Maturity Questions that must be answered: • Have you established a common process framework? • Is it followed by project teams? • Do you have management support for software engineering • Do you have a proactive approach to SQA? • Do you conduct formal technical reviews? • Are CASE tools used for analysis, design and testing? • Are the tools integrated with one another? • Have document formats been established?
Technology Risks Questions that must be answered: • Is the technology new to your organization? • Are new algorithms, I/O technology required? • Is new or unproven hardware involved? • Does the application interface with new software? • Is a specialized user interface required? • Is the application radically different? • Are you using new software engineering methods? • Are you using unconventional software development methods, such as formal methods, AI-based approaches, artificial neural networks? • Are there significant performance constraints? • Is there doubt the functionality requested is "do-able?"
Staff/People Risks Questions that must be answered: • Are the best people available? • Does staff have the right skills? • Are enough people available? • Are staff committed for entire duration? • Will some people work part time? • Do staff have the right expectations? • Have staff received necessary training? • Will turnover among staff be low?
Recording Risk Information Project: Embedded software for XYZ system Risk type: schedule risk Priority (1 low ... 5 critical): 4 Risk factor: Project completion will depend on tests which require hardware component under development. Hardware component delivery may be delayed Probability: 60 % Impact: Project completion will be delayed for each day that hardware is unavailable for use in software testing Monitoring approach: Scheduled milestone reviews with hardware group Contingency plan: Modification of testing strategy to accommodate delay using software simulation Estimated resources: 6 additional person months beginning 7-1-96