Download
1 / 3
30 likes | 231 Vues
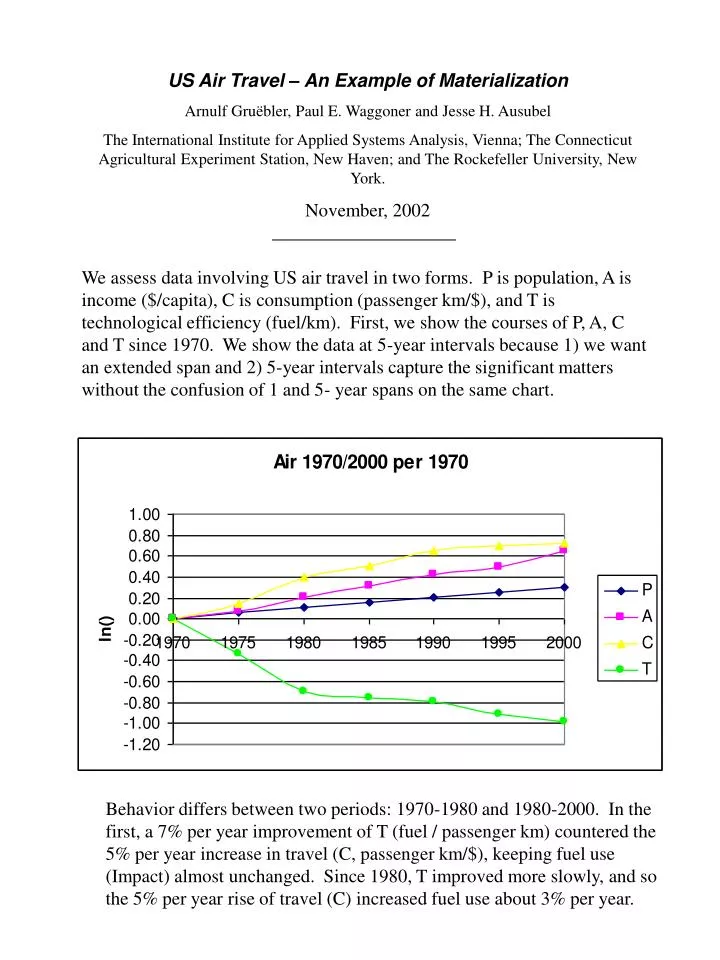
US Air Travel – An Example of Materialization Arnulf Gru ëbler, Paul E. Waggoner and Jesse H. Ausubel The International Institute for Applied Systems Analysis, Vienna; The Connecticut Agricultural Experiment Station, New Haven; and The Rockefeller University, New York. November, 2002

E N D
US Air Travel – An Example of Materialization Arnulf Gruëbler, Paul E. Waggoner and Jesse H. Ausubel The International Institute for Applied Systems Analysis, Vienna; The Connecticut Agricultural Experiment Station, New Haven; and The Rockefeller University, New York. November, 2002 We assess data involving US air travel in two forms. P is population, A is income ($/capita), C is consumption (passenger km/$), and T is technological efficiency (fuel/km). First, we show the courses of P, A, C and T since 1970. We show the data at 5-year intervals because 1) we want an extended span and 2) 5-year intervals capture the significant matters without the confusion of 1 and 5- year spans on the same chart. Behavior differs between two periods: 1970-1980 and 1980-2000. In the first, a 7% per year improvement of T (fuel / passenger km) countered the 5% per year increase in travel (C, passenger km/$), keeping fuel use (Impact) almost unchanged. Since 1980, T improved more slowly, and so the 5% per year rise of travel (C) increased fuel use about 3% per year.
The annual change in the basic parameters. The annual change in the ImPACT parameters.
We set out to find a good that ‘materialized’. The clear increase of C (km/GDP) indicates air travel serves our purpose. So we insert air travel in the concluding chart of our Supplement to ImPACT, Patterns, also posted on this site. Air travel’s purple course of T versus C to the southeast serves our purpose. It exemplifies materialization and improved efficiency even better than the black course for medical expenditure and life expectancy. Unlike the medical example, in which materialization and improved efficiency, measured as increased years of life per expenditure, slowed, air travel continued to materialize and grow more efficient over time.