Download
1 / 33
350 likes | 479 Vues
Incorporating DNA barcodes into assessments of the biological integrity of aquatic ecosystems. Mark Bagley, United States Environmental Protection Agency Charles Spooner, US EPA Ronald Klauda Maryland Dept of Natural Resources David Schindel, CBOL Lee Weigt

E N D
Incorporating DNA barcodes into assessments of the biological integrity of aquatic ecosystems Mark Bagley, United States Environmental Protection Agency Charles Spooner, US EPA Ronald Klauda Maryland Dept of Natural Resources David Schindel, CBOL Lee Weigt Robert Hanner, University of Guelph
Structure of Talk • Bioassessments, biological integrity and taxonomy • Application of DNA barcodes to stream bioassessments • From species to populations: Expanding from barcodes in bioassessments
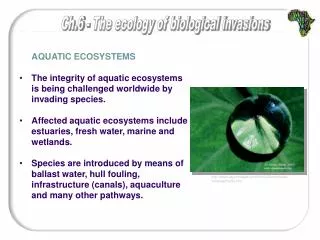
“Biological Integrity” and Environmental regulations Section 101 of the United States Clean Water Act requires federal and state governments to "restore and maintain the chemical, physical and biological integrity of the Nation's waters." Ecological Integrity Physical Integrity Chemical Integrity Biological Integrity
Biological Integrity The condition of an aquatic community inhabiting unimpaired waterbodies of a specified habitat as measured by an evaluation of multiple attributes of the aquatic biota. Three critical components of biological integrity are that the biota is (1) the product of the evolutionary process for that locality, or site (2) inclusive of a broad range of biological and ecological characteristics such as taxonomic richness and composition, trophic structure (3) found in the study biogeographic region. • (USEPA 1996)
Bioassessment • An evaluation of the biological condition of a waterbody using biological surveys and other direct measurements of the resident living organisms • Fish, macroinvertebrates, periphyton communities • Important component of the majority of water quality monitoring programs • indicators of cumulative impacts on biological integrity from aquatic stresses • nonpoint source pollution and other stressors. • Quantitative assessments of what the community looks like compared to “what it is supposed to look like” • Indicator species, multimetric indices, predictive models
Biological Assessment and the US Clean Water Act Source: EPA822-F-02-006, 2002
Bioassessments depends critically on good taxonomic identifications • Accuracy • Precision • Comparability of findings • Credibility
US EPA National Stream Survey Design • National assessment of the condition of wadeable streams • 10 different taxonomic ID laboratories • 749 stream macroinvertebrate samples • Organisms identified to genus • 10% random re-identification by independent taxonomist • Data quality objective – 85% repeatability
US EPA National Stream Survey Data Quality • 77% of random re-identifications were to the same genus (1st try) • 87% of random re-identifications were to the same genus after reassessment of data and correction of systematic errors • Good enough?
So many bugs, so few experts, such a pain to identify Taxonomy of North American Aquatic Flies (Diptera) Sources:G. Courtney, L. Ferrington
And progress in identifying aquatic larvae to species is slow Taxonomy of North American caddisflies (Trichoptera) 1966 - 40% of species known to science as larvae 2006 - 38% of 1418 described species with larvae known to science Source: John Morse
DNA Barcodes • A short DNA sequence from a standardized portion of the genome that is used to identify species • DNA barcodes provide an objective standard for species identification • Yada yada yada
Possible Advantages of DNA Barcodes for Bioassessment • Increased taxonomic resolution • Provide a common QA standard • Increase pool of expertise for taxonomic identification • Pathway towards more fully automated analyses • Objectivity, speed, cost (?)
Advanced Monitoring Initiative Project Goals • Develop a DNA barcode library for important aquatic indicator species (EPT) • Ephemeroptera (Mayflies) • Plecoptera (Stoneflies) • Trichoptera (Caddisflies) • Compare DNA barcodes to traditional bioassessments for EPT taxa • Cost, Speed, Objectivity, Accuracy, Precision • How important is increased taxonomic precision? • Determine how to efficiently incorporate DNA barcodes into a state bioassessment program
Barcode development • Develop barcode with COI sequences from taxonomically resolved adult specimens (Smithsonian collection) • Add COI sequences for larval samples collected as part of Maryland’s state bioassessment • Link larval and adult forms by DNA and incorporate ancillary data to complete barcode record
Repeatability and barcode development Maryland DNR Guelph Reference Barcode Database Smithsonian (taxonomic agreement) EPA Lab EPA (disagreement or MOTU) Taxon Experts (Smithsonian) Morphology DNA (adult specimens) Repeatability Accuracy Precision Cost Repeatability Precision Cost Species Description
Tech Transfer is Important! • End users are participants in the project • Maryland DNR, EPA-Water • Tech transfer documents, hands-on workshops, and protocols are key products • Chose end-users that will be influential in “converting” others
Diplectrona modesta Parapsyche apicalis Cheumatophyche sp. Potamyia sp. Hydropsyche betteni Hydropsyche aerata Hydropsyche simulans Hydropsyche betteni Hydropsyche bidens/incomoda Hydrophyche venularis/ scalaris Symphitophyche sp. Hydrophychidae sp. 0.1 TrichopteraNet spinning caddisflies (Hydropsychidae) 677 bp COI 102 specimens NJ tree
H 240 H 245 H 259 H 255 H 270 H 263 H 264 H 231 H 261 H 249 H 244 H 391 H 260 H 275 H 241 H 248 H 269 H 250 H 368 H 230 H 251 H 232 64 H 252 H 268 H 239 H 247 99 H 243 H 253 99 H 256 H 390 H 387 100 100 92 H 432 H 246 H 433 H 420 100 H 274 H 273 99 H 402 H 406 H 419 0.02 Diplectrona modesta “Hydropsychidae” 59
Hydropsyche aerata H 703 H 485 99 Hydropsyche simulans H 525 99 58 H 452 H 519 Symphitopsyche bronta/morosa H 314 Hydropsyche betteni H 517 Hydropsyche bidens/incommoda 62 H 518 Hydropsyche venularis 53 H 474 99 Hydropsyche scalaris 67 H 484 H 707 Symphitopsyche bronta/morosa H 846 Symphitopsyche bifida 99 H 844 Symphitopsyche bronta/morosa H 845 0.05
Preliminary comparison of sequence divergences
Summary • Bioassessments are critical components of water quality programs • Their wider implementation is hindered by lack of taxonomic expertise, poor resolving power of morphology, and expense. • DNA barcodes can revolutionize biaossessments, removing previous roadblocks and bringing new sophistication to the field • One key to success will be partnership with morphological taxonomists to find efficient ways forward
But why stop at barcodes? • The hard part is getting buy-in from bioassessment programs to transition to DNA surveys • Once DNA is analyzed and archived for barcodes, it is available for more complex analyses of population structure and dynamics
Mill Creek Watershed, Cincinnati, OH, USA Ohio EPA aquatic habitat assessment
Genetic Analysis • 4 mainstem, 3 tributary, and one ‘control’ site sampled for central stonerollers (Campostoma anomalum) in 2001-2002 • 4 mainstem sites also sampled in 1994-1995 • Sample sizes ranged from n=10 to n=103 • All samples genotyped at 10 microsatellite loci
MC1 MC2 MC6 MC7 MC3 MC8 MC5 TC Population structure analysis
Estimation of effective population sizes and connectivity (MLNE) Site MC1, t-1 (Resident Pool) Immigrant Pool migration Genetic drift Site MC1, t-2 ~ m, Ne
Estimates of local effective sizes and immigration rates Source-sink dynamics?
Mill Creek Watershed, Cincinnati, OH A genetic tool for watershed management?
Acknowledgements • Advanced Monitoring Initiative Co-investigators and Collaborators • Chuck Spooner, Suzanne Jackson, Eric Waits, Mike Blum, US EPA • Lee Weigt, Amy Driscoll, Smithsonian Institution • David Schindel, CBOL • Ron Kluida, Ellen Friedman, Maryland DNR • Robert Hanner, University of Guelph