Download
1 / 10
100 likes | 197 Vues
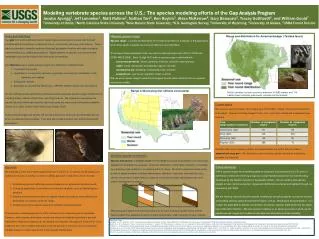
Modeling 3D copepod distributions on Georges Bank during 1995 and 1999 Davis, Ji, Beardsley, Chen, Townsend, Flagg, Runge, Durbin. Stock ̶ Recruitment. Number of Recruits. Spawning Stock Biomass. Biomass at Age. GLOBEC Georges Bank Objective:

E N D
Modeling 3D copepod distributions on Georges Bank during 1995 and 1999 Davis, Ji, Beardsley, Chen, Townsend, Flagg, Runge, Durbin
Stock ̶ Recruitment Number of Recruits Spawning Stock Biomass Biomass at Age GLOBEC Georges Bank Objective: To understand the processes controlling recruitment of cod and haddock and their dominant prey species. Georges Bank Haddock
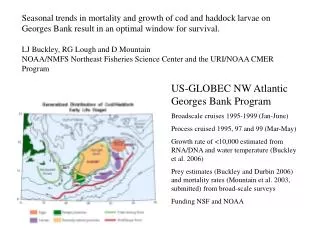
Georges Bank cod/haddock spawning and larval and juvenile drift (Lough and Manning, 2001) Pratt Haddock larva
The copepods: Centropages Hopcroft Pseudocalanus Calanus Oithona Hopcroft 1 mm Hopcroft Temp & Food Dependent: Fertility Molting Growth Mortality Davis
Results (cont): Broadscale Surveys Broad-scale Phytoplankton vs Salinity Salinity Anomaly Copepods vs Year Cod & Haddock Growth vs Copepods Cod & Haddock Mortality vs Year Cod & Haddock Mortality vs Salinity Anomaly
Greene and Pershing, 2007 Science 1990s Freshening Freshwater in early 1990s traced to Arctic • AO+ winds strengthen Beaufort Gyre • AO- winds release freshwater
Present Work, Synthesis: Models Basin-scale Model Regional-scale Model
S1: Uptake (P on N) S1=μmaxf(I)f(N)f(T)P S2: Grazing (Z on P) S2=gmaxf(P)f(T)Z S3: Loss of P S3=λP S4: Remineral. of D S4=εD S5: Loss of Z S5=mZ2 Eggs Nauplii Copepodids Adults Copepod Population 4-Stage (ENCA) Lower Food Web S5 Z γS5 αS2 S2 βS2 P (1-α-β)S2 S3 S1 N D S4
100 100 100 Time t Time t+1 0 0 0 4-stage, ENCA A E N C (Hu et al., in press) 0 Time (d) 70 Numerical Diffusion & Mean-Age Model 200 age-stage classes, 13-stages Number of individuals 200 age-stage classes, 13-stages E N C A