Download
1 / 36

E N D
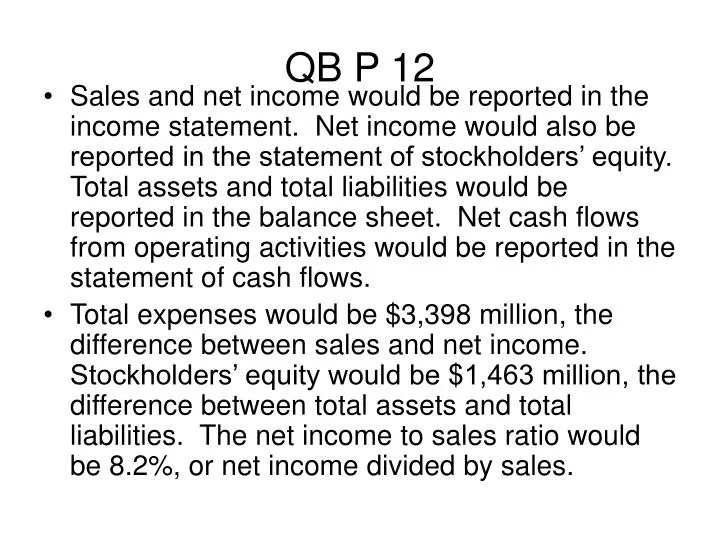
QB P 12 • Sales and net income would be reported in the income statement. Net income would also be reported in the statement of stockholders’ equity. Total assets and total liabilities would be reported in the balance sheet. Net cash flows from operating activities would be reported in the statement of cash flows. • Total expenses would be $3,398 million, the difference between sales and net income. Stockholders’ equity would be $1,463 million, the difference between total assets and total liabilities. The net income to sales ratio would be 8.2%, or net income divided by sales.
QB P 19 • Krispy Kreme’s earnings failed to live up to expectations. The market price of the stock was based on the market’s expectations for earnings and cash flow. Failure to meet their published earnings estimates caused the market to lower its expectations for future earnings and cash flow. The economic consequence of the downward adjustment in expectations was a downward adjustment to the value the market had placed on the stock. Since managers probably owned significant amounts of Krispy Kreme stock (or options to buy Krispy Kreme stock), the drop in the stock price almost certainly had a significant adverse impact on the personal wealth of those managers.
QB P 22 • Adecco and PricewaterhouseCoopers would have had a conversation about the magnitude and scope of the accounting irregularities, the impact on the financial statements and the extent to which the errors may have affected decisions made (or to be made) by persons relying on the accuracy of the 2003 financial statements. If it was determined that the financial statements were materially in error, corrections to the financial statements would have been discussed. Possible restatement of prior years’ financial statements may also have been discussed.
ID 1-13 a. Home Depot is a large retailing company, focusing on hardware sales to consumers and contractors. It is a retailer because it does not manufacture the goods that it sells. It buys products from vendors and offers those products for sale in its stores. b. The firm of KPMG audits the financial statements of Home Depot. The audit report consists of 4 paragraphs. The first paragraph states what years and financial statements were audited and therefore being commented upon by this audit report. The second paragraph explains what an audit is intended to do and how the company has gone about doing this audit. The third paragraph states the auditors’ opinion regarding the financial statements that have been audited. The final paragraph indicates a change in accounting methods by the company.
ID 1-13 c. Net income in 2003 was $4,304,000,000, for 2002 net income was $3,664,000,000 and for 2001 net income was $3,044,000,000. d. 2003 2002 . Current liabilities $9,554 27.7% $8,035 26.8% Long-term liabilities 2,476 7.2% 2,174 7.2% Total assets $34,437 $30,011 From 2002 to 2003 Home Depot increased its current liabilities by $1.5 billion and increased its long-term liabilities by $300 million. As a percentage of total assets, however, long-term liabilities remained constant. The ratio of current liabilities to total assets increased by nearly a percentage point. This shows that the increase in total assets (over $4 billion) was generated by the increase in current liabilities and net income. e. Cash from operating activities was $6,545,000,000 in 2003, in 2002 it was $4,802,000,000 and in 2001 was $5,963,000,000. f. Home Depot is considered to be one of the best-managed companies in the US. The company is extremely profitable (see c above), growing and well-capitalized. This financial condition is reflected in the company’s cash balance of over $2.8 billion and shareholders’ equity of over $22 billion.
Ex 2-1 • Financing • Operating • Operating • Investing • Financing • Financing • Investing • Operating
QB P 36 • McDonald’s Corporation’s current assets consist mostly of cash and short-term investments, receivables from franchisees, and inventories. Those amounts would be relatively small given the fast turnover involved in providing restaurant services, compared to the relatively large required investment in real estate, fixtures, and equipment.
QB’s p 39 • Short-term investments are made in readily marketable debt and equity securities to earn income on otherwise idle funds. An insurance company such as Aetna maintains a high level of short-term investments to insure that they will be able to pay claims, make refunds, and so on, on a timely basis. • The principal activities of banks such as Bank of America are to earn net interest income by gathering deposits and in turn loaning those funds out to others, as well as providing fee-based services. The largest asset category involved in this process is the loan portfolio. • Retailers such as Home Depot and manufacturers such as Goodyear Tire & Rubber are in the business of selling products, and carry significant amounts of inventory. Service enterprises such as Yahoo and financial institutions such as Bank of America do not deal in products and therefore do not have inventories.
QB P 43 • The primary source of funding for banks such as Bank of America is through deposits gathered from its diverse customer base. Banks do not present classified balance sheets, but most deposits are relatively short-term (current). Borrowings are a secondary source of funding, and are not as great as the deposit liability. Banks are highly leveraged, ie, stockholders’ equity represents a smaller portion of total assets (usually less than 10%).
QB P 44 • A deficit in retained earnings means that Amazon.com has not been profitable on a cumulative basis since its inception, net of any distributions to stockholders. This is not an uncommon situation for young companies, especially those in Internet related businesses.
QBs PP 46 & 47 • Cost of goods sold represents the original cost of inventory items sold by manufacturers, wholesalers, and retailers. This inventory cost is reported separately from other operating expenses. Service businesses such as H & R Block provide services and do not sell inventory, thus there is no cost of goods to report. • An excess of other expenses over other revenues would cause net income to be lower than net income from operating activities. Investors would be more concerned about net income from operating activities which would be expected to recur, while (significant) other revenues and expenses tend to be one-time items.
Problem 2-1 Presented below are the main section headings of the balance sheet: a. Current assets b. Long-term investments c. Property, plant, and equipment d. Intangible assets e. Current liabilities f. Long-term liabilities g. Contributed capital h. Retained earnings
Problem 2-1 E 1. Dividend Payable 2. Payments Received in Advance 3. Allowance for Uncollectible Accounts 4. Inventories 5. Capital Stock 6. Accumulated Depreciation - Building 7. Bonds Payable 8. Machinery and Equipment E, F A A G C F C
Problem 2-1 A 9. Accounts Receivable 10. Short-term Investments 11. Buildings 12. Patents 13. Property 14. Investment Fund for Plant Expansion 15. Wages Payable 16. Cash A C D C B E A
Problem 2-1 C 17. Accumulated Depreciation - Equip 18. Prepaid Rent 19. Trademarks 20. Land Held for Investment 21. Current Portion of Long-Term Debt 22. Accounts Payable 23. Short-term Notes Payable A D B E E E
Exercise 2-3 B Balance Sheet (B) or Income Statement (I) a. Equipment b. Fees Earned c. Retained Earnings d. Wage Expense e. Patent f. Cost of Goods Sold g. Common Stock h. Dividend Payable i. Accumulated Depreciation I B I B I B B B
Exercise 2-3 B Balance Sheet (B) or Income Statement (I) j. Prepaid Expense k. Gain on Sale of Short-term Investment l. Rent Revenue m.Supplies Inventory n. Accounts Receivable o. Land p. Insurance Expense q. Interest Payable r. Deferred (Unearned) Revenue I I B B B I B B
ID 2-9 a. 2004 2003 2002 . Sales $ 64,816 $ 58,247 $ 53,553 Cost of merchandise Sold 44,236 68.2% 40,139 68.9% 37,406 69.8% Operating expenses 13,734 21.2% 12,278 21.1% 11,215 20.9% Interest expense 62 0% 37 0% 28 .0% Taxes 2,539 3.9% 2,208 3.8% 1,913 3.6% Net income $ 4,304 6.6% $ 3,664 6.3% $ 3,044 5.7% From 2002 to 2004 sales increase dramatically (21%) and net income increased by 41%. During each of these years the cost structure of Home Depot changed very little. The biggest component of costs (cost of merchandise sold) fluctuated by only .3%. This would indicate that the increase in net income from 2002 to 2004 was driven by the increase in sales. There was no improvement in the costs as a percentage of sales.
ID 2-9 b. 2004 2003 . Current assets $13,328 38.7% $11,917 39.7% Noncurrent assets 21,109 61.3% 18,094 60.3% Total assets $34,437 $30,011 From 2003 to 2004 there has been a significant increase in noncurrent assets, $3 billion. The ratio of current vs. noncurrent assets though changed only minimally. This indicates that management is doing a good job of managing its assets and not becoming imbalanced between current and noncurrent assets. c. 2004 2003 . Current liabilities $9,554 27.7% $ 8,035 26.8% Long-term liabilities 2,476 7.2% 2,174 7.2% Total assets $34,437 $30,011 From 2003 to 2004 Home Depot increased its current liabilities by $1.5 billion and its long -term liabilities by $300 million. However, the ratio of long-term liabilities to total assets remained constant. The ratio of current liabilities to total assets increased by a relatively small percentage (.9%). This shows that the increase in total assets ($4.4 billion) was generated by the increase in current liabilities and net income.
ID 2-9 d. Home Depot is continuing to grow its business by investing heavily in p,p&e. During 2004 and 2003 Home Depot spent approximately $6.2 billion in p,p&e additions. This was financed by cash flow from operations ($11.3 billion). During 2004 and 2003 the company used excess cash to repurchase its own stock ($3.5 billion). e. 2004 2003 2002 . Net income $4,304 $3,664 $3,044 Dividends paid $595 $ 492 $ 396 Dividends as a percentage of net income 13.8% 13.4% 13.0%
QB P. 75 • Going concern is a fundamental assumption underlying our accounting model which uses historical costs as a valuation basis and classifies assets and liabilities and current and long-term. In making an evaluation of going concern status, auditors consider numerous factors such as negative trends (recurring operating losses, capital deficiencies, adverse financial ratios), other indicators of possible financial difficulties (default on loan agreements), and internal and external matters (labor difficulties, loss of a key customer or supplier). Auditors become concerned about the viability of a business when solvency and earning power decline to the point that continuation of the entity is in jeopardy. The stock market usually reacts to these issues long before the audited financial statements are issued. Improvements in solvency and earning power would relieve auditors of their concerns about the viability of a business. Auditors are concerned with the viability of a business as a going concern, because if a company were not expected to stay in business beyond the current year, then liquidation values would be a more appropriate valuation basis, and current and long-term classifications would be meaningless.
QB P 86 • The change had the effect of spreading revenue over several future years rather than all in the first year when the contracts were signed, thereby reducing current income and increasing future income. Spreading the revenue is a better example of the matching process. Certainly the company will have costs in future years to service the contracts, and spreading the revenues forward to those future years provides for a better matching of the cost of the efforts with the benefits.
Brief Exercise 3-1 1. Reporting period ends on Saturday closest to Jan. 31. Fiscal period 2. Consolidated financials include subsidiaries. Economic entity 3. Inventory valued at lower of cost or market. Conservatism 4. Reclassifications made to conform with this year’s presentation. Consistency 5. Revenues recognized when motion pictures exhibited. Revenue recognition
Brief Exercise 3-1(continued) 6. Management believes lawsuit will not have a material impact on Company’s financial position. Materiality 7. Equipment depreciated over 20 years. Matching (going concern, fiscal period) 8. Intangible assets carried on B/S at cost. Objectivity 9. Property and equipment recorded at cost. Going concern, Objectivity 10.Inflation rates have no effect on the company’s financials. Stable dollar
Question box p. 106 • Yes, the pharmaceuticals and the software companies become more valuable when critical events occur such as those described. Nonetheless, those events are not recorded in the financial statements, because they have not yet reached the point where their impact on the financial statements can be objectively measured.
Question box p. 106 • The basic accounting equation applied to the balance sheet of Zimmer Holdings is: • Assets = Liabilities + Stockholders’ Equity • $5,156 = $2,006 + 3,150
Question box p. 109 • Coca Cola’s purchase of $812 million of property, plant, and equipment would both increase and decrease assets by the same amount, because property, plant, and equipment would increase and cash would decrease. The borrowing of $1 billion would increase an asset, cash, and increase a liability, notes payable. • Let’s do E4-10 to see how transactions affect the accounting equation
E4-10 a. Assets = Liabilities + Stockholders' Equity Accounts Notes Contributed Retained Cash + Receivable + Land = Payable + Capital + Earnings (1)+12,000 +12,000 (2)+ 5,000 + 5,000 (3)- 10,000 +10,000 (4)- 5,000 - 5,000 (5)+10,000 +4,000 +14,000 (6)- 4,000 - 4,000 (7)+ 2,800 - 3,000 - 200 (8)- 2,200 - 2,200 Total 8,600 4,000 7,000 5,000 12,000 2,600
E4-10 Cash 12,000 Capital Stock 12,000 Cash Capital Stock 12,00012,000
E4-10 Cash 5,000 Notes Payable 5,000 Cash Notes Payable 12,000 5,000 5,000
E4-10 Land 10,000 Cash 10,000 Land Cash 10,000 12,000 10,000 5,000
E4-10 Rent Expense 5,000 Cash 5,000 Rent Expense Cash 5,000 12,000 10,000 5,000 5,000
E4-10 Cash 10,000 Accounts Receivable 4,000 Service Revenue 14,000 Cash Accounts Receivable 12,000 10,000 4,000 5,000 5,000 10,000 Service Revenue 14,000
E4-10 Miscellaneous Expense 4,000 Cash 4,000 Misc. Expense Cash 4,000 12,000 10,000 5,000 5,000 10,000 4,000
E4-10 Cash 2,800 Loss 200 Land 3,000 Cash Land 12,000 10,000 10,000 3,000 5,000 5,000 10,000 4,000 2,800 Loss 200
E4-10 Dividends 2,200 Cash 2,200 Cash Dividends 12,000 10,000 2,200 5,000 5,000 10,000 4,000 2,800 2,200 Compute the balance in the cash account $8,600