Download
1 / 14
140 likes | 155 Vues
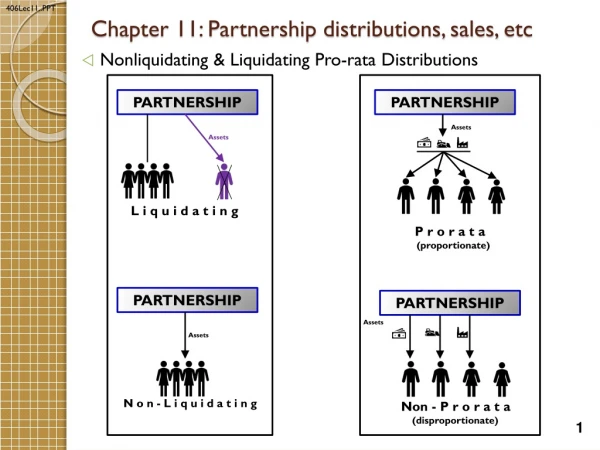
Chapter 11 Inference for Distributions. AP Statistics 11.2 – Inference for comparing TWO Means. 2-sample problems CI’s or Tests of Significance. One of the most common practices in all of statistics

E N D
Chapter 11Inference for Distributions AP Statistics 11.2 – Inference for comparing TWO Means
2-sample problemsCI’s or Tests of Significance • One of the most common practices in all of statistics • Goal: compare the responses of 2 different treatments on the same population OR compare the same characteristic from 2 different populations • Note that the samples can be of different sizes!
Comparing 2 Population Means • Conditions 1. We have twoSRS’s, from two distinct populations. Samples must be independent of one another. Measure the same variable for both samples 2. Both populations are normally distributed. The means (µ) and standard deviations (σ) of the population are unknown. 3. Both populations are at least 10 times the size of the sample
Inference Between Two Means • Population Parameters • Sample Statistics • Test hypothesis of NO difference b/w populations OR
2 sample t-procedures CI’sHyp Tests
Example 11.12: Two Sample t Confidence Interval • Construct a 90% CI for the mean advantage of calcium over a placebo. • Note: Sample size strongly influences P-value of a test!
Robustness Again • 2-sample more robust than 1-sample • When planning 2-sample, try to have equal sizes (not necessary though) • Most robust against nonnormality and with larger samples (P-values are most accurate) • Recall Robust: C-level or P-Value does not change very much when assumptions (normality) of the procedure are violated • Resistant to change
More Accurate levels in the t-procedures • Note: 2-sample t-statistic does not have a t-distribution! • Approximate distribution of a 2-sample t-statistic df = • This approximation is quite accurate when both sample sizes n1 and n2≥ 5.
The Pooled 2-sample t procedures • “unequal” vs. “equal” variances • Assume 2 pops. have same variance, averages “pools” the 2-sample variances to estimate a common population variance • Sample sizes must be the same! • *outdated* used to be more common before software made it easier. • Can not use pooled t in DDT example b/c clear that variance is much larger among rats fed DDT.