Download
1 / 38
380 likes | 454 Vues
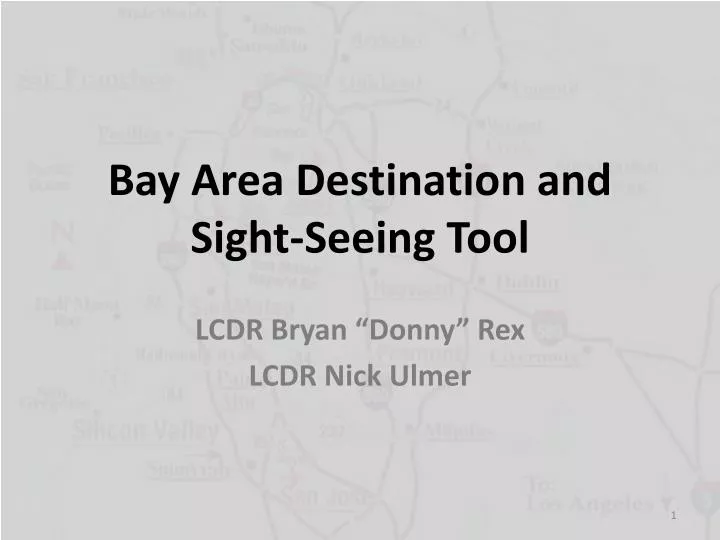
Bay Area Destination and Sight-Seeing Tool. LCDR Bryan “Donny” Rex LCDR Nick Ulmer. Goal of the B.A.D.A.S.S. Tool. Develop a versatile Monterey day-trip planning tool that provides a better solution than simply running Google Maps. Make the tool customizable with user preferences.

E N D
Bay Area Destination and Sight-Seeing Tool LCDR Bryan “Donny” Rex LCDR Nick Ulmer
Goal of the B.A.D.A.S.S. Tool • Develop a versatile Monterey day-trip planning tool that provides a better solution than simply running Google Maps. • Make the tool customizable with user preferences. • Achieve a robust architecture that is adaptable to rush hour, construction, and other delays. i.e. Google Maps on Steroids!
Destination Nodes: Muir Woods NM San Francisco Half Moon Bay Napa Sonoma Santa Cruz 1 2 3 6 5 4 7 9 8 10 11 12 13 14 15 16 17 19 18 24 20 21 22 23 25 26 30 31 27 29 28 32 33 34 35 36 37 38 39
How It Works Dest • Set up a network model with intersections as nodes and roads as arcs. • Convert undirected cyclic graph to DAG. • Destination nodes plug into the network through multiple dummy arcswith negative values. • Run MIP shortest path. Sounds easy, right?
How the Network gets BIG T=End It’s called Time Layering . . . . T0902-Coyote T=48 . . . Implemented with Python code to create layers moving forward through time at a 2 minute interval, calculating every possible arc. T0848-SantaCruz T=4 T=2 T=0 T0800-Monterey 50,000 Nodes +/- thousands 150,000+ Arcs
The MIP and GAMSA Quick Glimpse • Basic Shortest Path MIP • An interface was designed in Python to create a network with user prioritized destinations through the use of negative costs. • Each programmable destination node can be visited multiple times with diminishing returns. • Each 1-hour destination visit can be accomplished only once. • Road arcs assume small penalties in order to discourage wandering. There are no constraints involving the number of times a road arc can be utilized • Output Generation Control • All input and output is in standard units of time and distance. • Like Google Maps, the suggested optimal route is displayed in standard form (i.e. N101, NGoldenGateBridge, etc) through the use of Acronyms.
Assumptions For Our Examples: • Visits are in one hour increments • Time on the road is not desirable {Penalty=(Distance/Speed)*.1} • Rush hours are set to 0700-0930 and 1500-1800 • The delay is based off of Caltrans and manual data collection • Destinations have limited hours • Ex: Muir Woods is only available during daylight and Napa/Sonoma do not open until 11 am • Posted Speed Limits are observed/maintained All assumptions can be modified through adjustments to input data files and/or python script.
Glimpse of TripArcs.csv Costs: Small penalty assigned for driving. (Positive for shortest path)
Glimpse of TripArcs.csv Costs: User defined enjoyment preferences decrement by 1 per hour spent at destination (negative for shortest path)
Glimpse of TripArcs.csv Delays: Currently set at 1 hour per destination visit. Manually assignable delays are available to represent construction, accidents, etc.
Glimpse of TripArcs.csv Arc Names: 137 Distinct Arcs. These represent each road (NSWE) and an additional arc for each destination visit. Arc IDs: 247 Different IDs. These represent each road (NSWE) plus the ID corresponding to each distinct 1 hour destination visit
Network Generation in Python nodes.csv arcs.csv arcData.csv ArcAcronyms.csv *LunchArcs.csv* TripArcs.csv NodeData.csv
Trip 1 Overview User Input: Muir Woods (10) San Francisco (9) Napa (7) Sonoma (6) Half Moon Bay (3) Santa Cruz (1) Depart: 0830 Return: 0030 Road delays: Rush Hour (AM/PM) B.A.D.A.S.S. Recommendation: Stop 1 - Muir Woods (9 hours) Stop 2 – San Francisco (2 hours) Total Fun Factor: 70.5 Total Distance 295 mi
Trip 1 w/Delay User Input: Muir Woods (10) San Francisco (9) Napa (7) Sonoma (6) Half Moon Bay (3) Santa Cruz (1) Depart: 0830 Return: 0030 Road delays: Rush Hour (AM/PM) 101 South (SFO) > 15 min B.A.D.A.S.S. Recommendation: Stop 1 - Muir Woods (9 hours) Stop 2 – San Francisco (2 hours) Total Fun Factor: 70.5 Total Distance 292 mi
Recall the preferences: Let’s Change the starting time and analyze….
Less Time = Less Fun Obvious results. Less Friday classes means getting to leave earlier and that equals more fun.
Less Time = Less Fun Interesting that 0800 to 1000, there is little loss in fun value. While the drop between 1000 and 1300 is much more significant. Obvious results. Less Friday classes means getting to leave earlier and that equals more fun.
How Many Hours And Where? Useful to see how Departure time effects the locations visited.
How Many Hours And Where? The effects of Rush Hour Point where going to Muir Woods is no longer the best plan. Useful to see how Departure time effects the locations visited.
Trip 3 - Vino Trip! User Input: Muir Woods (0) San Francisco (5) Napa (10) Sonoma (10) Half Moon Bay (0) Santa Cruz (0) Depart: 0700 Return: 2000 Road delays: Rush Hour (AM/PM) B.A.D.A.S.S. Recommendation: Stop 1 – Santa Cruz (1 hour) Stop 2 – San Francisco (1 hour) Stop 3 – Napa (4 hours) Stop 4 – Sonoma (1 hour) Total Fun Factor: 48.4 Total Distance 336 mi
Trip 4 – No Preference User Input: Muir Woods (5) San Francisco (5) Napa (5) Sonoma (5) Half Moon Bay (5) Santa Cruz (5) Depart: 0700 Return: 2359 Road delays: Rush Hour (AM/PM) B.A.D.A.S.S. Recommendation: Stop 1 – 0740-0840 Santa Cruz (1 hr) Stop 2 – 0956-1156 San Francisco (2 hr) Stop 3 – 1244-1444 Napa (2 hr) Stop 4 – 1500-1700 Sonoma Visit (2 hr) Stop 5 – 1912-2212 Santa Cruz (3 hr) Total Fun Factor: 40.4 Total Distance 340 mi
Flipping Everything On Its Head • Parallel Applications • Politician’s Campaign Trail, Itineraries for Distinguished Visitors, City Planners, etc • Hypothetical Scenario: • Restaurant franchise is considering opening a new location. • Possible locations:
Scenario Possible new locations User Destination Lunch Hour Must be observed within 1100 and 1300.
What did we change?In Math Speak… Include the ‘fun’ of having lunch to the objective function
What did we change?In Math Speak… Ensure we do not use a lunch arc unless we are stopping for lunch.
What did we change?In Math Speak… Only stop for one lunch during the trip.
What did we change?In Math Speak… Can only have two values, either have lunch or not.
The Results Average Gap = 6.1714 Sausalito chosen 4 times. A late departure forces the user to San Jose for lunch.
Interpreting the Results • A restaurant opening in these locations must represent a ‘fun’ value greater than 6 for an individual with this set of preferences to deviate and patronize the restaurant. • A wider scope of preferences run using this tool can offer insight onto areas for focusing marketing/advertising. • An even larger study can be used with location costs to determine best return on investment.
If We Had More Time…B.A.D.A.S.S. Tool Version 3.0 • More Robust Interface • More Preference Options • One Button “Go” • Graphical input and output • Improved Output Report • Multi-Day (Weekend) Mode • Multi-Trip Mode (automated analysis) • More Destinations