Download
1 / 65
770 likes | 1.58k Vues
Ultrasound. Introduction. History (Hendee and Ritenour, 2002). In 1880, French physicists Pierre and Jacques Curie discovered the piezoelectric effect. “Piezo” is Greek for pressure. Piezoelectricity refers to the generation of an electrical response to an applied pressure .

E N D
Ultrasound Introduction
History (Hendee and Ritenour, 2002) • In 1880, French physicists Pierre and Jacques Curie discovered the piezoelectric effect. “Piezo” is Greek for pressure. Piezoelectricity refers to the generation of an electrical response to an applied pressure. • French physicist Paul Langevin attempted to develop piezoelectric materials as senders and receivers of high frequency mechanical disturbances (ultrasound waves) through materials. His specific application was the use of ultrasound to detect submarines during Word War I. This technique, sound navigation and ranging (SONAR), finally become practical during World War II.
Industrial uses of ultasound began in 1928 with the suggestion of Soviet Physicist Sokolov that it could be used to detect hidden flaws in materials. • Medical uses of ultrasound through the 1930s were confined to therapeutic applications such as cancer treatments and physcial therapy for various ailments. • Diagnostic applications of ultrasound began in the late 1940s through collaboration between the physicians and engineers with SONAR.
Acoustic Wave Energy Ranges • Just as there are infrared, visible, and ultraviolet ranges in the EM spectrum, so there are infrasound (“infra” = “below,” “beneath”), audible (i.e., sound) and ultrasound (“ultra” = “beyond,” “above”) ranges of acoustic wave frequencies • Note that the ratio of the highest to the lowest audible frequencies is 103, or almost 10 octaves. On the other hand, the ratio of the highest to the lowest frequencies of visible light is a bit less than 2 (i.e., less than one octave). Infrasound Ultrasound Audible 20 Hz 20 kHz
Different Forms of Energy • Electromagnetic • Photons (quantum description), electromagnetic waves (classical description • Does not require a material medium through which to propagate • Mechanisms of propagation through material media are different from that of propagation through free space • Acoustic • Requires a material medium through which to propagate • Consists of oscillatory motions of the atoms/molecules of which a material is constituted. • Oscillating particles have kinetic energy square of amplitudes of their motions • Through action of intermolecular forces, particles transfer their energy to adjacent particles energy wave traveling through material.
Transfer/Transformation of Energy • Light becomes sound — photoacoustic phenomena • Sound becomes light — sonoluminescence • Absorbed electromagnetic (EM) and acoustic energy both become heat • Nevertheless, EM and acoustic energy are FUNDAMENTALLY DISTINCT PHENOMENA!
Ultrasound Intensity • As an ultrasound wave passes through a medium, it transports energy through the medium. • The rate of energy transport is known as power. • Medical ultrasound is produced in beams that are usuallys focused into a small area, and the beam is described in terms of the power per unit area, defined as the beam’s intensity. • No universal standard reference intensity exist for ultrasound. “ultrasound at 50 dB was used” is nonsensical. “the returning echo was 50 dB below the transmitted signal” is informative.
The power consumed by a force F that has moved an object by a distance l İn time t is given by An ultrasound is a pressure wave. Power P carried by an ultrasonic wave is Thus the instantaneous intensity can be expressed as
Safety limits Maximum ultrasound intensities (mW/cm2) recommended by the US Food and Drug Administration for various diagnostic applications.
Ultrasound velocity • The velocity of ultrasound wave through a medium varies with the physical properties of the medium. • Low-density media (air and other gases): molecules may move over relatively large distances before they influence neighboring molecules. the velocity of ultrasound wave is low. • High-density media (solids): molecules are constrained in their motion. the velocity of ultrasound wave is high. • Liquids exhibit ultrasound velocities intermediate between those in gases and solids. • In different media, changes in velocity are reflected in changes in wavelength of the ultrasound waves, with the frequency remaining relatively constant.
Attenuation of Ultrasound As an ultrasound beam penetrates a medium, energy is removed from the beam by • absorption, • scattering, and • reflection As with x-rays, the term “attenuation” refers to any mechanism that removes energy from the ultrasound beam. Ultrasound is “absorbed” by the medium if part of the beam’s energy is converted into other forms of energy, such as an increase in the random motion of molecules. If the obstacle’s size is large compared with the wavelength of sound then part of the beam may be “reflected” and the remainder “transmitted” through the obstacle as a beam of lower intensity. If the size of the obstacle is comparable to or smaler than the wavelength of the ultraound, the obstacle will “scatter” energy in various directions.
Clinical Potential of Attenuation Measurements Note, overall attenuation coefficient β, not only absorption or only (back)scattering Infarcted myocardium Healthy myocardium That is, ultrasound attenuation and backscatter measurements can be used (among many other things) to assess extent of tissue death in myocardial infarction
Reflection • In most diagnostic applications of ultrasound, use is made of uultasound waves reflected from interfaces between different tissues in the patient. The fraction of the impringing energy reflected from an interface depends on the difference in acpustic impedance of the media on opposite sides of the interface. • The acoustic impedance Z of a medium is the product of the density of the medium and velocity of ultrasound in the medium. An alternative definition: Acoustic impedance = pressure/particle velocity Compare electrical circuit analogue : impedance = voltage/current
Notice how similar these values are to each other and to that for water, metal gas acrylic and how different they are from these. soft tissues hard tissue
pi pr Z1, u1 pt Z2, u2 Reflection and Refraction • Behavior or ultrasound at an interface between materials of different Z is analogous to behavior of light at interface between materials of different refractive index. • Fraction of pressure reflected = Reflection Coefficient, R; fraction of pressure transmitted = Transmission Coefficient, T • Intensity reflection and transmission coefficients are derived from the preceding equations and p = Zu and I = p02/(2Z):
Z3 Z1 Z2 incident wave Transmitted wave l2 Transmission through plates (normal incidence) The coefficient for transmission of incident energy into medium 3 is given by:
important cases: 1) Cos k2=1 l2=n2 (where n is an integer) Transmission through such a layer is independent of the layer material. 2) Sin k2=1 l2=(2n-1)2/4 If Z2=(Z1Z3)1/2 then =1. This situation has considerable practical value in maximizing coupling between transducer materials and liquid media.
Refraction • As an ultrasound beam crosses an interface obliquely between two media, its direction is changed (i.e., the beam is bent). If the velocity of ultrasound is higher in the second medium, then the beam enters the medium at a more oblque (less steep) angle. This behavior of ultrasound transmitted obliquely across an interface is termed refraction. • The relationship between the incident and refraction angles is decribed by the Snell’s law: • The incidence angle at which refraction causes no ultrasound to enter a medium is termed the critical angle c.
Piezoelectric Effect • The piezoelectric effect is exhibited by certain crystals that, in response to applied pressure, develop a voltage across oppsite surfaces. This effect is used to produce an electrical signal in response to incident ultrasound waves. • Similarly, application of voltage across the crystal casues deformation of the crystal. This deforming effect, termed the converse piezoelectric effect, is used to produce an ultrasound beam from a transducer. • Many crystals exhibit the piezoelectric effect at low temperatures, but are unsuitable aas ultrasound transducers because their piezoelectric properties do not exist at room temperature. The temperature above which a crystals’s piezoelectric properties disappear isa known as Curie point of the crystal.
Piezoelectric Properties • Efficiency of the transducer is the fraction of applied energy that is converted to the desired energy mode. For an ultrasound transducer, this definition of efficiency is dexribed as the electromechanical coupling coeffcient kc . • If mechanical energy (i.e., pressure) is applied, we obtain • If electrical energy is applied, we obtain
Transducer design • The piezoelectric crystal is the functional component of an ultasound transducer. A crystal exhibits its greatest response at the resonance frequency. • The resonance frequency is determined by the thickness t of the crystal (the dimension of the crystal along the axis of the ultrasound beam). A crystal of half-wavelength thickness resonates at a frequency v: Example: a 1.5 mm thick quartz disk (c =5740 m/sec in quartz) has a resonance frequency of v=5740/2 (0.0015)=1.91 MHz.
Dflo-Q Amplitude A (fres) = 0 dB - 3 dB Frequency Transducer Q-factor • Disc of piezoelectric material (usually PZT), mechanical resonance frequencies fres Resonance curve (Q-factor, Q = fres/Df ; Df is -3 dB width of curve) • High Q: strong resonance(narrow curve) • Low Q: strongly damped, weak resonance (broad curve) • Tradeoff of high Q: • Efficient at fres (high signal-to-noise ratio) • Pulse distortion (ringing effect) Dfhi-Q
Trasducer Backing • With only air behind the crystal, ultrasound transmitted back into the cylinder from the crystal is reflected from the cylinder’s opposite end. The reflected ultrasound reinforces the ultrasound propagated in the forward direction from the transducer. This reverberation of ultrasound in the transducer itself contributes energy to the ultrasound beam (i.e., it increases the efficiency). It also extends the time over which the ultrasound pulse is produced. Extension of the pulse duration (decreases bandwidth, increases Q) is no problem in some clinical uses of ultrasound such as continuous wave applications. • However, most ultrasound imaging applications utilize short pulses of ultrasound, and suppression of ultrasound reverberation is desirable. Backing of transducer with an absorbing material(tungsten powder embedded in epoxy resin) reduces reflections from back, causes damping at resonance frequency • Reduces efficiency • Increases Bandwidth (lowers Q)
Transducers in Pulsed / C.W. Mode • Low bandwidth: • No backing • High efficiency (SNR) • High-Q • Strong “Pulse ringing” c.w. applications • Large Bandwidth: • Pulsed applications • Backing, matching • Low-Q • Lowered efficiency The characteristics of a 5MHz transducer for pulsed applications
Ii It Ir Transducer – Tissue Mismatch • Impedance mismatch causes reflection, inefficient coupling of acoustical energy from transducer into tissue: ZT 30 MRaylZL 1.5 MRayl It/Ii = 0.18 • Solution: Matching layer(s) • increases coupling efficiency • damps crystal oscillations, increases bandwidth (reduces efficiency) ZL ZT Load (tissue) Transducer
Matching Layers • A layer between transducer and tissue with ZT>Zl>ZLcreates stepwise transition • Ideally, 100 % coupling efficiency across a matching layer is possible because of destructive interference of back reflections if • layer thickness =/4 • Zl chosen so that Ir,1=Ir,2 : • Problems: Finding material with exact Zl value (~6.7 MRayl) • Dual-layer: ZL Zl ZT MatchingLayer Load (Target) Transducer It Ii Ir,1 It,L Ir,l Ir,2
Axial beam profile • Ultrasound sources may be considered to be a collection of point sources, each radiating spherical wavelets into the medium. • Interference of the spherical wavelets establishes a characteristic pattern for the resulting wavefronts. • The reinforcement and cancellation of individual wavelets are most noticable in the region near the source of ultrasound. They are progressively less dramatic with increasing distance from the ultrasound source. • The region near the source where the interference of wavelets is most apparent is termed the Fresnel (or near) zone. For a disk shape transducer of radius r, the length Z0 of the Fresnel zone is
Fresnel zone Fraunhofer zone
Within the Fresnel zone, most of the ultrasound energy is confined to a beam width no greater than the transducer diameter. • Beyond the Fresnel zone, some of the energy escapes along the preriphery of the beam to produce a gradual divergence of the ultrasound beam that is described by where is the Fraunhofer divergence angle in degrees. The region beyond the Fresnel zone is termed the Fraunhofer (or far) zone .
Rules for Transducer design • For a given transducer diameter, • the near field length increases with increasing frequency, • beam divergence in the far field decreases with incresing frequency, • For a giver transducer frequency, • the near field length increases with increasng transducer diameter, • beam divergence in the far field decreases with increasing transducer diameter. Example: What is the length of the Fresnel zone for a 10-mm diameter, 2MHz unfocused ultrasound transducer? = 1540 m/sec / 2x10⁶/sec =0.77 mm. Z0 = (5mm)2/0.77 mm = 32.5 mm
Transducer radius and ultrasound frequency and their relationship to Fresnel zone and beam divergence
Lateral Beam Profile • Isoecho contours: each contour depicts the locations of equal echo intensity for the ultrasound beam. At each of these locations, a reflecting object ( small steel ball) will be detected with equal sensitivity. Connecting these locations with lines yields isoecho contours. • Isoecho contours help depict the lateral resolution of a transducer, as well as variations in lateral resolution with depth. • For disc (radius r, piston source):
Axial and Lateral Resolution • Axial resolution determined by spatial pulse length t c (t = pulse duration). Pulse length determined by location of -3 dB point. • Lateral resolution determined by beam width (-3 dB beam width or - 6 dB width)
Focusing of Ultrasound • Increased spatial resolution at specific depth • Self-focusing radiator or acoustic lens
Transducer Arrays • Switched Array lateral scan • Phased Array for beam steering, focusing
Array Types • Linear Sequential (switched) ~1 cm 10-15 cm, up to 512 elements • Curvilinearsimilar to (a), wider field of view • Linear Phasedup to 128 elements, small footprint cardiac imaging • 1.5D Array3-9 elements in elevation allow for focusing • 2D PhasedFocusing, steering in both dimensions
A Mode (Amplitude Mode) • Oldest, simplest type • Display of the envelope of pulse-echoes vs. time, depth d = ct/2 • Pulse repetition rate ~ kHz (limited by penetration depth, c 1.5 mm/s 20 cm 270 s, plus additional wait time for reverberation and echoes)
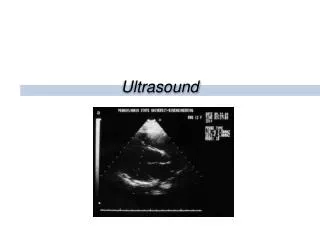
B Mode (“Brightness Mode”) • The location of echo-producing interfaces is displayed in two-dimensions (x,y) on a video screen. The amplitude of each echo is represented by the brightness value at the xy location. • Lateral scan across tissue surface
Real-Time B Scanners • Frame rate Rf ~30 Hz Rf d N = c/2 d: depth, N: no. of lines
M-Mode (“Motion Mode”) • Recording of variation in A scan over time (cardiac imaging: wall thickness, valve function)
detector detector Doppler Effect • When there is relative motion between a source and a detector of ultrasound, the frequency of the detected ultrasound differes from t he emitted by the source. • An ultrasound source is moving with velocity vs toward the detector. After time t, following the production of any wavefront, the distance between the wave front and the source is (c-vs)t, where c is the velocity of the ultrasound in the medium. The wavelength of the ultrasound in the direction of motion is shortened=(c-vs)/ f0 where f0 is the frequency of ultrasound from the source.
With the shortened wavelength, the ultrasound reaches the detector with an increased frequency : • That is, the frequency of the detected ultrasound shifts to a higher value when the ultrasound source is moving toward the detector. The shift in the frequency
If the velocity c of ultrasound in the medium is much greater than the velocity vs of the ultrasound source, then c-vc~ c and • A similar expression is applicable to the case in which the ultrasound source is stationary and the detector is moving toward the source with velocity vd. In this case, the Doppler shift frequency is approximately where c>>vd.
If the ultrasound source is moving away from the detector, then the distance between the source and a wavefront is ct+vst = (c+vs)t, where t is the time elapsed since the production of the wavefront. The wavelength of the ultrasound is =(c+vs)/ f0 and the apparent frequency f is • That is, the frequency shifts to a lower value when the ultrasound source is moving away from the detector. The shift in frequency is
If the velocity c of ultrasound in the medium is much greater than the velocity vs of the ultrasound source, then c+vS~ c and • A similar expression is applicable to the case in which the ultrasound source is stationary and the detector is moving toward the source with velocity vd. In this case, the Doppler shift frequency is approximately where c>>vd.