Download
1 / 17
170 likes | 176 Vues
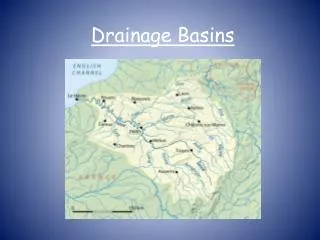
Measured Removal of Nitrogen from Drainage Through Riparian Buffers (per 100’). Quality of Buffer Nitrogen Removal High 68-92% Medium 45-68% Low 15-45%. From: US Department of Agriculture. Nitrogen Removal or Accumulation Processes. Storage in Vegetation Storage in Soils

E N D
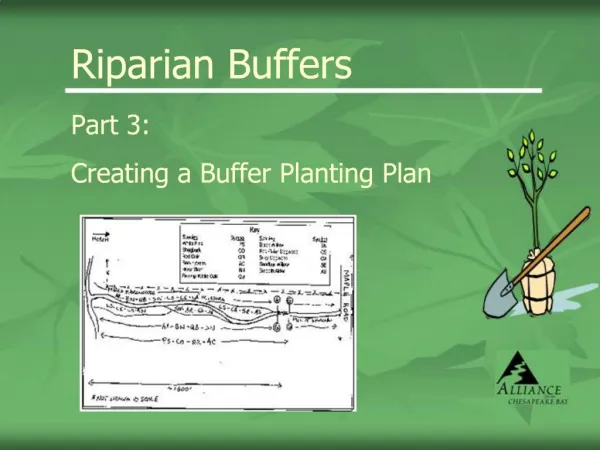
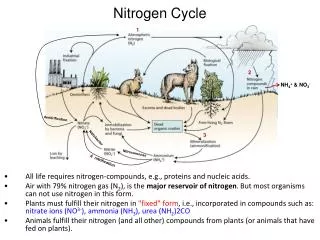
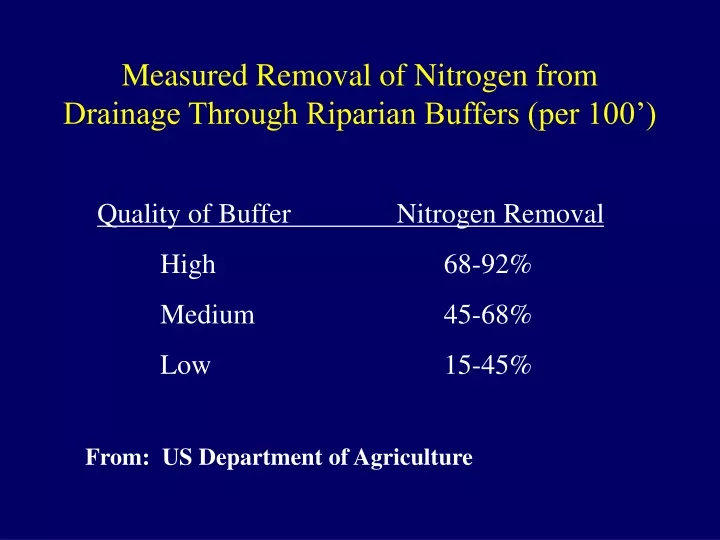
Measured Removal of Nitrogen from Drainage Through Riparian Buffers (per 100’) Quality of Buffer Nitrogen Removal High 68-92% Medium 45-68% Low 15-45% From: US Department of Agriculture
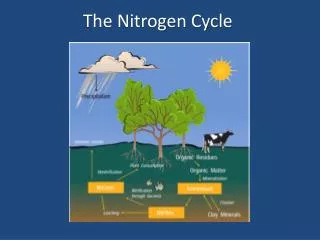
Nitrogen Removal or Accumulation Processes • Storage in Vegetation • Storage in Soils • Biological Denitrification • Chemical Denitrification • Volatilization
Storage in Vegetation • Nitrogen taken up by plants is used to build tissues and is stored as protein. • Woody vegetation accumulates nitrogen on a scale of decades to centuries. • The greatest accumulation occurs during the transition from one steady state to another (e.g. when farmland is converted to grassland and forest). • Harvesting prolongs the accumulation period.
Storage in Soils • Detritivores reduce dead organic material into (detritus) simpler compounds and relatively stable residual organic materials that are collectively referred to as soil organic matter. These are generally complex long-chained organic compounds. • Soil organic matter reaches a steady state with additions from dead material and losses as ammonia and nitrate. • The residence time of nitrogen in soils is on a scale of decades to centuries.
Biological Denitrification • This process occurs in oxygen-depleted environments typical of saturated soils and wetlands. • Anaerobic organisms utilize the oxygen in nitrate and the carbon in organic matter for their metabolism. The net result is a release of elemental nitrogen (N2) nitrous oxide (N2O), and carbon dioxide (CO2) as gases to the atmosphere. • Saturated soils and wetlands could in principle supply the biomass for denitrification indefinitely.
Chemical Denitrification • In oxygen-depleted environments there are chemical as well as biochemical pathways for denitrification. In soils and wetlands it is difficult to separate these biological from chemical processes. • Chemical denitrification processes are much more important in deeper aquifers than in soils, wetlands, and shallow aquifers. • Chemical denitrification processes primarily involve reduced iron and sulfur compounds. Nitrate is converted to nitrogen gas (N2) and iron and sulfur are oxidized. • Depletion of iron and sulfur compounds in deeper aquifers will occur on a scale of decades to centuries or perhaps even millennia.
Volatilization • Ammonia (NH3) volatilization and loss to the atmosphere can occur where organic materials are decomposing under anaerobic conditions. • Ammonia loss from non-agricultural soils and wetlands is generally a minor pathway for nitrogen removal. • Ammonia is very soluble in water and has a short residence time in the atmosphere. • Almost all of this loss to the atmosphere returns to the soil with rainfall within a few days over a dispersed area.
Wells in Olmsted County that Exceeded the Nitrate Drinking Water Standard by Geologic Formation (1960-1988) • From: Olmsted County Well Index, Minnesota Geological Survey, 1989. Bedrock FormationPercent of Wells Upper Carbonate 27 St. Peter 5 Prairie du Chien 7 Jordan 1
Olmsted County Nutrient Balance For Agriculture (1990-1994 Average)