Download
1 / 23
230 likes | 309 Vues
2009 COMMUNITY SURVEY Presentation of Final Results January 21, 2010. PROJECT SUMMARY. The WTA Strategic Plan recommended implementation of several major service and facilities projects, including a network of high frequency corridors and building a new northern transit hub.

E N D
2009COMMUNITY SURVEY Presentation of Final Results January 21, 2010
PROJECT SUMMARY • The WTA Strategic Plan recommended implementation of several major service and facilities projects, including a network of high frequency corridors and building a new northern transit hub. • WTA began implementing these recommendations in 2005 and all major recommended projects have been completed. • The primary purpose of this survey is to measure the satisfaction of the general public and riders with services since the implementation of major these service modifications. 1
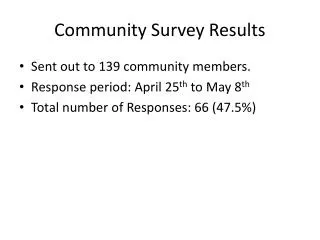
METHODOLOGY- ResidentTelephone Survey • Telephone surveys conducted with Whatcom County residents between 11/4 and 11/18/2009. • Overall sample of 824 provides accuracy of + 3.4% at a 95% confidence level. • 411 surveys were conducted with Bellingham residents. • 413 surveys were conducted with County residents outside of the City limits. • The subsets provide accuracy at + 4.8% at a 95% confidence level. 2
AWARENESS • Just under half of residents have read or seen something in the media about WTA in the past few months. 4
FAMILIARITY WITH BUS SERVICE • Sixty-one percent of residents say they are at least somewhat familiar with WTA bus service. 5
RESIDENTS WHO RODE THE BUS IN THE PAST YEAR AND FREQUENCY OF USE • Over one-third of residents say they rode the bus in the last year and 35 percent of those say they rode the bus at least twice a week. 6
PERCEIVED CHANGE IN BUS SERVICE 2004-2009 • More than half of residents think that bus service has improved from 2004-2009. 7
EVALUATION OF CHANGES IN SERVICE • Frequency of service (43%) followed by span of weekday service (35%) were cited as having improved most over the past five years. 8
AWARENESS OF GO LINES • Half of the residents have heard of the GO Lines and of those 43 percent say the GO Lines run more frequently than other routes. 9
ROLE OF BUS SERVICE • WTA provides a needed service. • WTA provides an option for “choice riders.” • WTA is good for the economy and environment. 10
SATISFACTION WITH BUS SERVICE • Fifty-seven percent of residents are satisfied or very satisfied with WTA services. 11
LEVEL OF SERVICE • Eighty-seven percent of residents think bus services should be maintained or increased. 12
AWARENESS OF REVENUE DOWNTURN • Just over one quarter of Whatcom County residents knew there was a funding shortfall prior to taking the survey. 13
OPTIONS FOR ADDRESSING SHORTFALL • More than half of Whatcom County residents say that a sales tax increase should be used to maintain or expand WTA service. 14
METHODOLOGY- Onboard Survey Surveys conducted with onboard riders between November 30 and December 5, 2009. Surveys were conducted throughout the service day to secure a representative sample of all riders. 596 surveys were completed, providing a margin of error of + 4.0% at a 95% confidence level. Service improvements results reflect only non-student data. 15
ONBOARD RESPONDENT PROFILE • The survey respondents approximate the ridership distribution of students and non-students. 16
BUSES USED TO COMPLETE TRIP • More than half of the respondents completed their trip without a transfer. 17
EVALUATION OF CHANGES IN SERVICE • Frequency and hours of service were considered to be the most improved by onboard respondents. Non-student responses only. 18
AWARENESS OF REVENUE DOWNTURN • Just under half of the onboard respondents know that WTA revenues are down. 19
OPTIONS FOR ADDRESSING SHORTFALL • Over half of the onboard respondents supported a sales tax increase to maintain service levels. 20
SERVICE REDUCTIONS • Decreasing Sunday service, the GO lines and service to rural areas were the top three considerations for service reductions. 21
SERVICE EXPANSION • Increasing evening and Sunday service and the GO Lines were the top ranked choices for service expansion. 22