Download
1 / 16
160 likes | 334 Vues
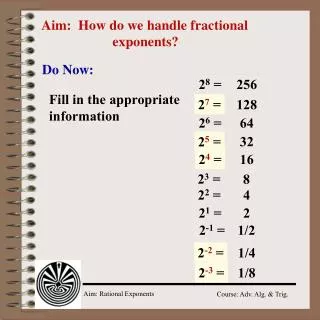
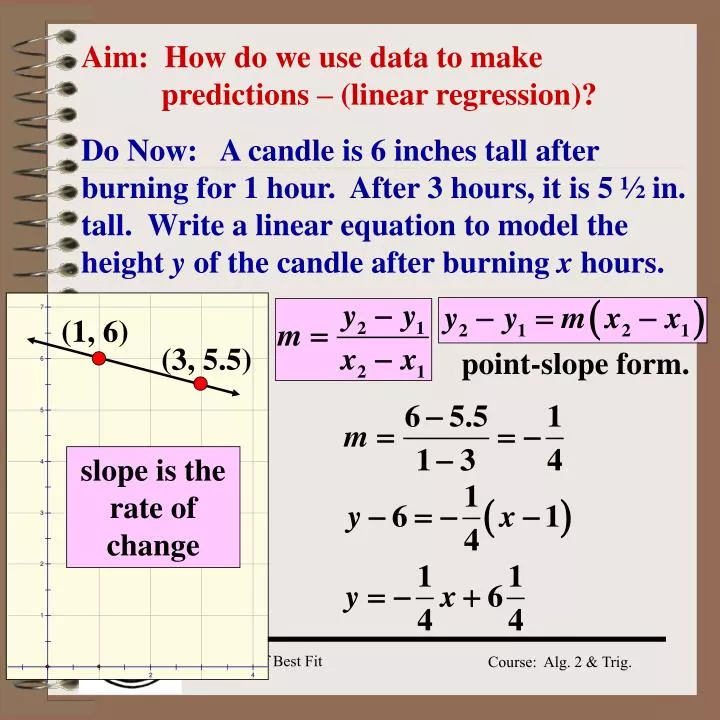
Aim: How do we use data to make predictions – (linear regression)?. (1, 6). (3, 5.5). point-slope form. Do Now: A candle is 6 inches tall after burning for 1 hour. After 3 hours, it is 5 ½ in. tall. Write a linear equation to model the height y of the candle after burning x hours.

E N D
Aim: How do we use data to make predictions – (linear regression)? (1, 6) (3, 5.5) point-slope form. Do Now: A candle is 6 inches tall after burning for 1 hour. After 3 hours, it is 5 ½ in. tall. Write a linear equation to model the height y of the candle after burning x hours. slope is the rate of change
(4, 9) Do Now Extension (1, 6) Do Now: A candle is 6 inches tall after burning for 1 hour. After 3 hours, it is 5 ½ in. tall. (3, 5.5) In how many hours will the candle be 4 inches tall? y - height of candle x - hours. x = 9 hours
Interpreting Data The cost of attending college is steadily increasing. The chart shows the average tuition and fees for a full-time resident student at a public four-year college. Estimate the average college cost in the academic year beginning in 2007 if tuition and fees continue at this rate.
(1997, 3111) (1992, 2349) Finding Best Fit Equation Average Tuition and Fees 3500 • Select 2 points that represent the data 3300 3100 2900 • Determine slope 2700 2500 2300 2100 • Calculate equation of best fit line 1900 1700 1990 1991 1992 1993 1994 1995 1996 1997 1998
Positive Correlation • y tends to increase as x increases • slope is positive • Negative Correlation • y tends to decrease as x increases • slope is negative No Correlation Scatter Plots & Correlation A Scatter Plot is a graph that relates two different sets of data by plotting the data as ordered pairs.
0 < r< 0.5 positive/weak 0.75 <r< 1 strongly positive -0.5 <r < 0 moderately negative Correlation Co-efficient Data that are linear in nature will have varying degrees of goodness of fitto the lines of fit. The correlation coefficient r describes the nature of data. The closer the fit of the data to the line, the closer r gets to + 1 or -1
Making Predictions Trend line – approximates the relationships between data sets of a scatter plot. Projected cost in 2006-2007 Predict cost for 2006-2007 academic year by substituting 2006 for x in best fit equation. Prediction: cost for tuition and fees will be $4482.60
The least square regression line, y = ax + b, for the point (x1, y1), (x2, y2), (x3, y3), ….. (xn, yn) is given by Least Squares Regression Line How can we find an equation that fits the data more closely if the correlation is not very high? Thank you TI 83+!!
Enter data: Enter years into L1 Enter dollars into L2 1 STAT STAT 1 Ensure coordinate pairs correspond Using Graphing Calculator to Determine Equation of Best Fit.
2nd Y = ENTER Graph results: ZOOM 9 Calculate the regression line: STAT ENTER 4 Using Graphing Calculator to Determine Equation of Best Fit. ENTER
VARS 1 ENTER ENTER ENTER GRAPH TRACE Using Graphing Calculator to Determine Equation of Best Fit. Graph the regression line: STAT ENTER 4
6 pt. Regents Question The availability of leaded gasoline in New York State is decreasing, as shown in the accompanying table. Determine a linear relationship for x (years) versus y (gallons available), based on the data given. The data should be entered using the year and the gallons available (in thousands), such as (1984, 150)
6 pt. Regents Question The availability of leaded gasoline in New York State is decreasing, as shown in the accompanying table. If this relationship continues, determine the number of gallons of leaded gasoline available in New York State in the year 2005.
6 pt. Regents Question The availability of leaded gasoline in New York State is decreasing, as shown in the accompanying table. If this relationship continues, during what year will leaded gasoline first become unavailable in New York State?
Model Problem • The table contains the fat grams and calories in various fast-food chicken sandwiches. • Find the equation of the regression • Predict the number of calories in a sandwich with 20 grams of fat.