Download
1 / 15
150 likes | 340 Vues
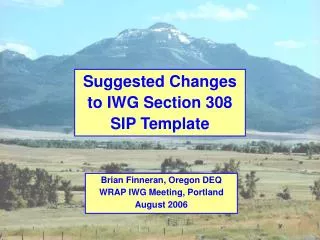
Update on Regional Haze 308 SIP Template. Brian Finneran, Oregon DEQ WRAP IWG Meeting, Santa Fe December 2006. Basic Format for 308 SIP TEMPLATE. 1. Introduction 2. Regional Haze SIP Development Process 3. Introduction to each Class I Area 4. Regional Haze Monitoring

E N D
Update on Regional Haze 308 SIP Template Brian Finneran, Oregon DEQ WRAP IWG Meeting, Santa Fe December 2006
Basic Format for 308 SIP TEMPLATE 1. Introduction 2. Regional Haze SIP Development Process 3. Introduction to each Class I Area 4. Regional Haze Monitoring 5. Basic Plan Elements 6. Current Visibility Conditions • Visibility Impairment Analysis • Emission Inventory 9. Long-Term Strategy 10. Best Available Retrofit Technology (BART) Evaluation 11. Reasonable Progress Goal Demonstration 12. Consultation with FLMs, States, Tribes 13. Misc. other SIP commitments
What’s changed since last updateof the RH SIP Template? • A lot more work than I originally thought… • Gradually has turned into an “Oregon” SIP template, given the need to start work on our own SIP. • Have been adding charts and graphs using the WRAP TSS, (see examples), similar to the Colorado draft SIP. • Has been an evolving format (e.g., by monitor site rather than by Class I area) by figuring out what should go where. • No longer anticipate completing a “generic” template to replace the original IWG version – but Oregon draft SIP can serve as an example to follow. • Now posted on the Oregon DEQ RH website at: www.deq.state.or.us/aq/haze/docs/draftSIP.pdf
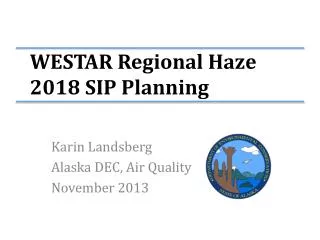
Examples of charts & graphsrecently added Figure 3.1.1: Map of Crater Lake NP
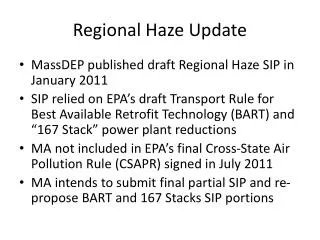
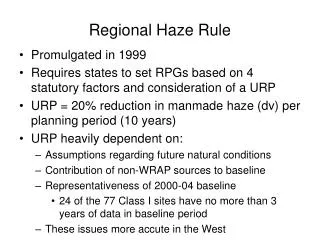
Examples of charts & graphsrecently added Mt. Hood IMPROVE Site Mt. Hood Wilderness Area Uniform Rate of Progress for 20% Best & Worst Visibility Days New IMPROVE Equation 17 16 Worst Days Baseline = 14.86 dv 15 14 2018 Goal = 13.20 (reduction needed 1.7 dv) 13 12 11 10 9 20% Best & Worst Visibility Days [deciview] 8 Natural Conditions = 7.76 dv 7 6 5 4 Best Days Baseline = 2.17 dv 3 2 1 0 2000 2004 2018 2064 Year
Examples of charts & graphsrecently added Figure 7.1-1: Mt. Hood IMPROVE Site Aerosol Composition 20% Worst Days Baseline (2000-2004)
Table 6-1 Best and Worst Days Baseline Conditions for Oregon Mandatory Class I Federal Areas Examples of charts & graphsrecently added Figure 7.1-2: Mt. Hood IMPROVE Site Baseline Worst Day Aerosol Composition compared to Visibility Improvement needed by 2018 & 2064 40 0.2% 38 6.6% 1.9% SeaSalt 36 30.1% 7.6% CM 34 Soil 32 EC OC 30 38.8% 14.8% NO3 28 SO4 26 24 22 Reconstructed Extinction on 20% worst days [Mm-1] 20 7.1 18 Deciview 16 14 12 10 8 6 1.7 4 Deciview 2 0 Baseline Average (2000-2004) 2018 Improvement Needed 2064 Total Improvement Needed
Oregon 308 SIP TEMPLATEHow it looks now • Introduction History and Background of RHR, purpose of SIP, definitions • Overview of Visibility and Regional Haze • Oregon Class I Areas (list) • Summary of Section 308 and 309 of the Regional Haze Rule • Background on the Regional Haze Rule • Phase I Visibility Rules – the Oregon Visibility Protection Plan • The 1990 Clean Air Act Amendments • Submittal of the 2003 Oregon 309 SIP • Purpose of this Document • Definitions and Acronyms contained in this plan • Oregon Regional Haze SIP Development Process General description of the consultation process and public involvement • Federal Land Manager Consultation • State and Tribal Consultation • Advisory Committee Involvement • Public and Stakeholder Outreach
Oregon 308 SIP TEMPLATEHow it looks now • Introduction to Oregon Class I Areas General introduction and description of each Class I area • Regional Haze Monitoring Description of monitoring strategy and summary of IMPROVE network • Overview of Oregon Regional Haze Monitoring Strategy • IMPROVE site locations in Oregon • Basic Plan Elements Overview of basic elements of the SIP, review of key terminology. • Anthropogenic Sources of Visibility Impairment • Baseline Conditions • Natural Sources of Visibility Impairment • Natural Conditions • Uniform Rate of Progress • Reasonable Progress Goal
Oregon 308 SIP TEMPLATEHow it looks now 6. Oregon Current Visibility Conditions Summary of monitoring data that shows current conditions 7. Oregon Visibility Impairment Analysis Summary of monitoring data that shows impairment – aerosol composition, species trends, presumptive GP, URP 8. Emission Inventory – Current (2002) and Projected (2018) Summary of all emissions data • Oregon Emissions by Source Category • Local (Nearby) Emissions for Each Class I Area by Source Category • Regional Emission Maps • Back Trajectory Maps • TSSA emissions modeling
Oregon 308 SIP TEMPLATEHow it looks now 9. Long-Term Strategy • Overview of the LTS • Summary of Interstate Transport and Contribution • Other State Class I Areas affected by Oregon emissions • Oregon Class I Areas affected by Other States • Estimated International Contribution to Oregon Class I Areas • Estimated Non-Anthropogenic Sources and their contribution to Oregon Class I Areas • Summary of all Anthropogenic Sources of Visibility Impairment considered in developing the LTS • Emission Reductions Due to Ongoing Air Pollution Programs • Measures to Mitigate the Impacts of Construction Activities • Emission Limitations and Schedules of Compliance • Source Retirement and Replacement Schedules • Agricultural and Forestry smoke management techniques • Net Effect on Visibility from the LTS • Emission Reductions from point, area, and mobile sources • Projection of 2018 Visibility Conditions from 2002 Base Case
Oregon 308 SIP TEMPLATEHow it looks now • Best Available Retrofit Technology (BART) Evaluation Summary of BART process, modeling, and control evaluation results • Oregon BART-eligible sources • Summary of BART Modeling Results • Summary of BART Control Analysis • Visibility Improvement Resulting from BART Evaluation in Oregon and Other States • Reasonable Progress Goal Demonstration Comparison of all haze strategies (chapters 9 & 10) to glide path, analysis if add’l controls are needed & affirmative RFG demonstration • Projected 2018 Visibility Conditions - Base Case vs. Control Case Scenarios • Review of Visibility Improvement from combination of BART modeling and regional modeling results. • Weight of Evidence summary for each Class I area • Comparison of RPG to the URP for each Class I area • Assessment if Additional Controls Measures are needed • Affirmative Demonstration of Reasonable Progress
Oregon 308 SIP TEMPLATEHow it looks now • Consultation Similar to Chapter 2, but provides more info and details • Federal Land Manager Consultation • Other State Consultation • Consistency with Neighboring State SIPs • Oregon & Neighboring State Emission Reduction Obligations • Tribal Consultation • Public and Stakeholder Outreach • OTHER SIP REQUIREMENTS AND COMMITMENTS • Enforceability of Emission Limitations and Control Measures • Commitment to Future SIP Revisions • Commitment to Periodic Progress Reports • Determination of Plan Adequacy • Public Participation and Review Process List of Appendices and Technical Support Documentation
Work to do – Remaining Issues • Chapters 1-7 fairly complete – mostly just add more text description, and technical data from the TSS (current Class I visibility conditions and impairment analysis). • Chapter 8 Emissions, Chapter 9 Long Term Strategy and Chapter 10 BARTresults still need a lot of work. Summarizing Emissions data and BART results fairly straightforward. Describing the LTS is going to be a major undertaking… • The biggest challenge is Chapter 11 Reasonable Progress Goal Demonstration. Major concerns are: • What methodology or approach should be used to show RP? Similar to Lee’s RP Demonstration Case Study for Starkey Oregon? How rigorous a demonstration will be needed here? • What yet unfinished WRAP TSS related work is going to be needed to complete the RP demonstration? Will TSS final work be too late in terms of meeting the Dec 2007 deadline?