Download
1 / 16
160 likes | 263 Vues
Magnetic connection between the photosphere and the corona. S. Kamio Solar Seminar 2003.12.15. Introduction. Magnetic field must play an important role in the connection between photosphere and corona may be related to surge, macro spicule, or EUV blinker?.

E N D
Magnetic connection between the photosphere and the corona S. Kamio Solar Seminar 2003.12.15
Introduction • Magnetic field must play an important role in the connection between photosphere and corona • may be related to surge, macro spicule, or EUV blinker? Handy and Schrijver, 2001, ApJ, 547, 1100. Schrijver and Title, 2003, ApJL, 597, 165. De Pontieu et al., 2003, ApJL, 595, 63.
Observation Observation campaign in Aug 1997 Long period of 85hr • EIT/SOHOFe XII 195Å (peak sensitivity at 1.6x10⁶ K)FOV 660”x 660” (2.5” / pixel)cadence of 17 min • MDI/SOHOHigh resolution magnetogramFOV 620”x 387” (0.6” / pixel)cadence of 1 min Handy and Schrijver (2001)
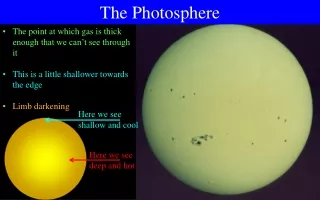
Data Processing • Remove diffuse haze in EIT data by high-pass filter enhancing small scale structures • MDI images are averaged over 7 min Raster: EIT, Contour: MDI
Emerging flux 14Mm (most frequent) • Emerging flux larger than 1018Mx are associated with an EIT bright feature. • When footpoint separation reached about 14Mm, which is comparable to super-granule size, coronal loop reconnect to more distant flux concentrations.
Reconnection • flux merging in the super-granular cell boundary (about 30hr) • In the course of the merging, positive flux reconnected to the negative flux of distant active region (110Mm apart). 30hr
Flux vs. separation • Correlation between footpoint separation and magnetic flux in the footpoint • Flux must exceed 3x10¹⁸Mx to appear bright in EIT image EIT resolution limit
Flux vs. intensity • Correlation between magnetic flux in footpoint and integrated loop intensity • Extension of the relation between large scale field and 1MK corona (Schrijver 1990)
Spatial autocorrelation Anisotropy in NS and EW Isotropy East-west North-south • Anisotropy is due to large scale loops connecting active regions. • There is no preferred orientation of small scale loops
Lifetime • Lifetime is defined as the time when correlation amplitude drops to 1/e. • Nominally 14-20hr for quiet corona(1MK).
Field line (1) • Potential field approximation • Field lines starting from 7Mm above the photosphere are displayed. • Classical network canopy model Schrijver and Title (2003)
Field line (2) • Field line starting from network concentration of 3x10¹⁸Mx • In this case, a half of flux fall back to internetwork region. • Contribution of internetwork field is ignored in classical canopy model.
Intensity oscillation • Intensity oscillation in active region plage • Crosses mark the location of oscillation • Periods 250-600s TRACE 171Å Hα(SVST) De Pontieu et al.(2003)
Light curves • Light curves and wavelet power of oscillating points
Correlation • Significant correlation between upper chromosphere and transition region. • Less clear correlation between photosphere and transition region,delay of 150s • Propagating wave?
Template • Contents