Download
1 / 19
190 likes | 297 Vues
Potential Energy Curves. Notes and Virtual Lab Activity – AP Mechanics. Energy and Work. Lab Part 2. Click on the picture below to be directed to pHet’s virtual skate-park lab. (Click “run now!” once on site.)

E N D
Potential Energy Curves Notes and Virtual Lab Activity – AP Mechanics
Energy and Work LabPart 2 Click on the picture below to be directed to pHet’s virtual skate-park lab. (Click “run now!” once on site.) Use the lab handout to set the parameters for each portion of this lab then use the virtual lab to investigate work and energy and answer the lab questions.
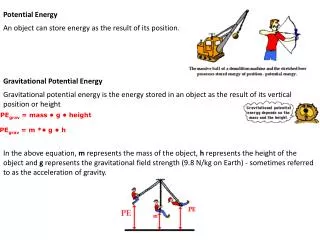
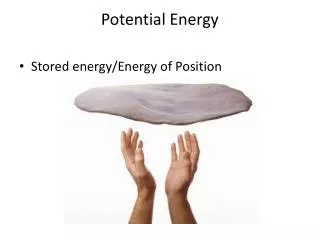
Energy and Work Potential Energy Curves We already know that We also know that work (done by a force) causes a change in energy.Consider the following… If we want to lift this bowling ball we have to apply a force and WE have to do work to it. The work we do to the ball would be called the work applied (because our applied force is acting through some distance). Fapp h As the ball moves upward the work applied is positive (increasing the potential energy) but the work done by gravity is negative (because mg is down but the motion is up). mg
Energy and Work Potential Energy Curves Let us assume that the ball was raised at a constant speed (a=0). We know then that the magnitudes of Fappand mg are equal. In raising the ball the work applied is Wapp= Fapph = mgh. This work (Wapp= mgh) increased the potential energy so we write: Fapp Wapp= +∆PE= +∆U mg h
Energy and Work Potential Energy Curves Let us assume that the ball was raised at a constant speed (a=0). We know then that the magnitudes of Fappand mg are equal. In raising the ball the work done by gravity isWg= -Fgh = -mgh.Notice that the value (no sign included) is the same as the work applied. This work (Wg= -mgh) is opposing the increase in the potential energy so we write: Fapp Wg= -∆PE= -∆U mg h
Energy and Work Potential Energy Curves Let us look at this in another way. What happens when we let go of the ball? Surprise!The ball falls. As it falls gravity does POSITIVE work on the ball and the potential energy DECREASES. Fapp +Wg= -∆PE= -∆U mg The FIELD will ALWAYS WORK to REDUCE the POTENTIAL ENERGY! h
Energy and Work Potential Energy Curves So now we know… Or focus is with a gravitational field, but this is true for any type of field OR restoring force. +Wfield= -∆PE= -∆U You have to STOP and THINK about the relationship between the signs of W and ∆U! If the force is causing an increase in the potential energy then both W and ∆U are positive. If the force is causing a decrease in the potential energy then ∆U will be negative.
Energy and Work Potential Energy Curves If potential energy is the (negative) antiderivative of force (with respect to displacement) then how would we find the force if we were given a potential energy function? Just go the opposite way….…the reverse process of the antiderivative is the derivative.
Energy and Work Potential Energy Curves The area of a Force vs Position graph gives the work done by that force.The opposite of the area of a force vs position graph give the change in potential energy. The opposite of the slope of a potential energy vs position graph gives the force acting on that particle.
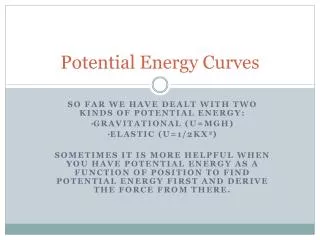
Energy and Work Potential Energy Curves • Potential Energy Curves graphically represent how the potential energy of a moving particle changes with its position. • Three “Flavors” • Stable Equilibrium • Unstable Equilibrium • Neutral Equilibrium • Equilibrium occurs when the net force acting on an object is zero, resulting in zero acceleration (Fnet= ma = 0). • Considering what we just learned, that means for a graph of potential energy vs position (known as a potential energy curve), we want to look for to identify points of equilibrium.
Total Energy U Energy and Work Potential Energy Curves StableEquilibrium – think back to the pHet Skater Lab. Due to the starting position of the skater, there was a certain total amount of energy available to the system. E As the skater moved, her potential energy increased and decreased. x 0
Total Energy U Energy and Work Potential Energy Curves StableEquilibrium – occurs when a SMALL displacement in the particle results in a restoring force that accelerates the particle back to the origin (its equilibrium position). Visualize the skater – a small displacement to the left (-x) would result in a restoring force which is positive (to the right). This would return her to the origin. E x F(x) = -dU/dx = -slope Because the slope is negative, the force is positive. When the skater is at x=0 the slope is zero; this represents an equilibrium point (which happens to be stable). 0 F(x) = -dU/dx = 0
Total Energy U Energy and Work Potential Energy Curves UnstableEquilibrium – occurs when a SMALL displacement in the particle results in a restoring force that accelerates the particle AWAY FROM the origin (its equilibrium position). Visualize the skater –if he stands atop a ramp that is concave down and he is displaced to the left, he will not return to his starting position. E x 0 If he was displaced (off of either side) his potential energy would decrease. He does, however, have energy due to his position
Total Energy U Energy and Work Potential Energy Curves UnstableEquilibrium – occurs when a SMALL displacement in the particle results in a restoring force that accelerates the particle AWAY FROM the origin (its equilibrium position). Visualize the skater – a small displacement to the left (-x) would result in a force which is negative (to the left). This would accelerate him away from the origin. E x F(x) = -dU/dx = -slope Because the slope is positive, the force is negative. When the skater is at x=0 the slope is zero; this represents an equilibrium point (which happens to be unstable). 0 F(x) = -dU/dx = 0
Total Energy Energy and Work Potential Energy Curves NeutralEquilibrium – occurs when a SMALL displacement in the particle results in no net force and the particle remains at rest. Visualize the skater –if he stands atop a ramp that has a flat portion and he is displaced (by a small amount) to the left or right, he won’t accelerate away. E U 0 x U=0 If he was displaced (slightly) to either side, he wouldn’t go anywhere. He does, however, have energy due to his position.
Total Energy Energy and Work Potential Energy Curves NeutralEquilibrium – occurs when a SMALL displacement in the particle results in no net force and the particle remains at rest. E U 0 x F(x) = -dU/dx = 0 If he was displaced (slightly) to either side, he wouldn’t go anywhere. F = -slope = zero = equilibrium!
Total Energy U Potential Energy Curves Energy and Work Last thing…I promise. E Consider a simple stable equilibrium situation (a skater skating back and forth in a “bowl” or a spring oscillating back and forth). There is a total amount of energy in the system (due to initial conditions). The kinetic energy can be found by applying the conservation of (mechanical) energy:E = U + KE x
Total Energy U Potential Energy Curves Energy and Work Last thing…I promise. E As the potential energy increases, the kinetic energy decreases. As the potential energy decreases the kinetic energy increases. The total energy, however, is always the same. KE The kinetic energy can be found by applying the conservation of (mechanical) energy:E = U + KE x
Potential Energy Curves Energy and Work In you lab packet complete part 3(Interpreting Potential Energy Curves). Each individual student is responsible for the content of this PowerPoint. Revisit this PowerPoint as needed to reinforce the concepts discusses. Each lab group is responsible for completing the lab portion of this activity and submitting one write up per group.