Download
1 / 1
10 likes | 192 Vues
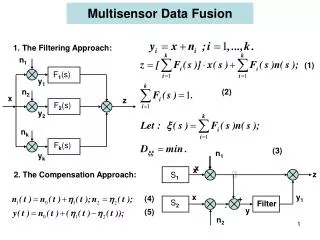
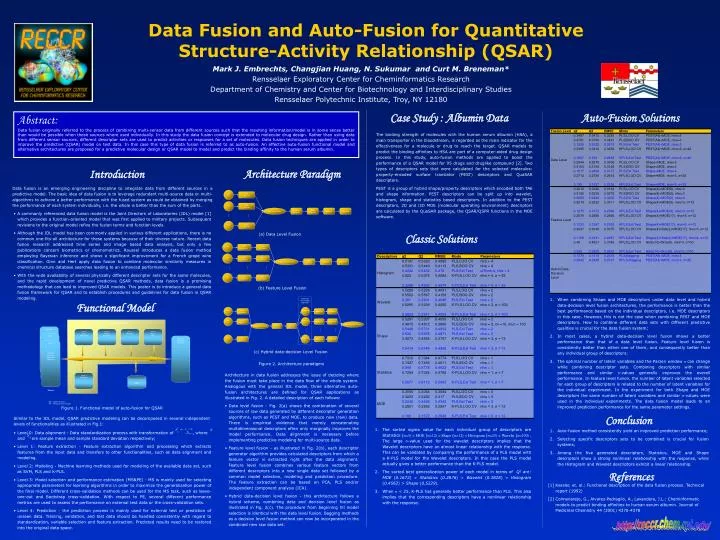
AUTO-FUSION DOMAIN. Bootstrap Resampling Replicates. RECON. Level 0 Data Alignment. Level 1 Feature Extraction. Level 2 Modeling. Level 3 MS* & PE*. PEST. Data 1. Data 1. Replicate 1. Human/ Computer Interface. Data Alignment. Data Alignment. Feature Extraction.

E N D
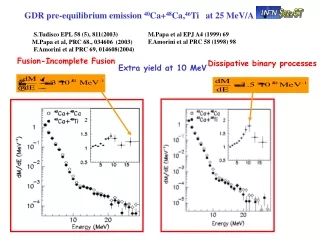
AUTO-FUSION DOMAIN Bootstrap Resampling Replicates RECON Level 0 Data Alignment Level 1 Feature Extraction Level 2 Modeling Level 3 MS* & PE* PEST Data 1 Data 1 Replicate 1 Human/ Computer Interface Data Alignment Data Alignment Feature Extraction Modeling Prediction MOE QSAR descriptor generation algorithms ¡ ¹ 0 x x S i ¹ x x Data 1 = i x S Data Alignment Data 2 Data 2 Replicate 2 x Data Alignment Data Alignment Feature Extraction Modeling Prediction Feature Level Fusion Model Selection Modeling Prediction Decision Level Fusion Data Level Fusion Feature Selection Model Selection Data 2 Data Alignment … … … … … … … … Level 4 Prediction Data Level Fusion Feature Selection Model Selection Modeling Prediction DBMS Data n Data n … … Replicate m Data Alignment Data Alignment Feature Extraction Modeling Prediction Sources Data n Data Alignment *MS – Model Selection *PE – Performance Estimation Data Fusion and Auto-Fusion for Quantitative Structure-Activity Relationship (QSAR) Mark J. Embrechts, Changjian Huang, N. Sukumar and Curt M. Breneman* Rensselaer Exploratory Center for Cheminformatics Research Department of Chemistry and Center for Biotechnology and Interdisciplinary Studies Rensselaer Polytechnic Institute, Troy, NY 12180 Case Study : Albumin Data Auto-Fusion Solutions Abstract: Data fusion originally referred to the process of combining multi-sensor data from different sources such that the resulting information/model is in some sense better than would be possible when these sources where used individually. In this study the data fusion concept is extended to molecular drug design. Rather than using data from different sensor sources, different descriptor sets are used to predict activities or responses for a set of molecules. Data fusion techniques are applied in order to improve the predictive (QSAR) model on test data. In this case this type of data fusion is referred to as auto-fusion. An effective auto-fusion functional model and alternative architectures are proposed for a predictive molecular design or QSAR model to model and predict the binding affinity to the human serum albumin. The binding strength of molecules with the human serum albumin (HSA), a main transporter in the bloodstream, is regarded as the main indicator for the effectiveness for a molecule or drug to reach the target. QSAR models to predict the binding affinities to HSA are part of a computer-aided drug design process. In this study, auto-fusion methods are applied to boost the performance of a QSAR model for 95 drugs and druglike compound [2]. Two types of descriptors sets that were calculated for the selected molecules: property-encoded surface translator (PEST) descriptors and QuaSAR descriptors. PEST is a group of hybrid shape/property descriptors which encoded both TAE and shape information. PEST descriptors can be split up into wavelet, histogram, shape and statistics based descriptors. In addition to the PEST descriptors, 2D and i3D MOE (molecular operating environment) descriptors are calculated by the QuaSAR package, the QSAR/QSPR functions in the MOE software. Architecture Paradigm Introduction Data fusion is an emerging engineering discipline to integrate data from different sources in a predictive model. The basic idea of data fusion is to leverage redundant multi-source data or multi-algorithms to achieve a better performance with the fused system as could be obtained by merging the performance of each system individually, i.e. the whole is better than the sum of the parts. • A commonly referenced data fusion model is the Joint Directors of Laboratories (JDL) model [1] which provides a function-oriented model that was first applied to military projects. Subsequent revisions to the original model refine the fusion terms and function levels. • Although the JDL model has been commonly applied in various different applications, there is no common one-fits-all architecture for these systems because of their diverse nature. Recent data fusion research addressed time series and image based data analysis, but only a few publications concern biometrics or chemometrics. Roussel introduces a data fusion method employing Bayesian inference and shows a significant improvement for a French grape wine classification. Ginn and Hert apply data fusion to combine molecular similarity measures in chemical structure database searches leading to an enhanced performance. • With the wide availability of several physically different descriptor sets for the same molecules, and the rapid development of novel predictive QSAR methods, data fusion is a promising methodology that can lead to improved QSAR models. This poster is to introduce a general data fusion framework for QSAR and to establish procedures and guidelines for data fusion in QSAR modeling. (a) Data Level Fusion Classic Solutions (b) Feature Level Fusion • When combining Shape and MOE descriptors under data level and hybrid data-decision level fusion architectures, the performance is better than the best performance based on the individual descriptors, i.e. MOE descriptors in this case. However, this is not the case when combining PEST and MOE descriptors. How to combine different data sets with different predictive qualities is crucial for the data fusion system; • In most cases, a hybrid data-decision level fusion shows a better performance than that of a data level fusion. Feature level fusion is consistently better than either one of them, and consequently better than any individual group of descriptors; • The optimal number of latent variables and the Parzen window σ can change while combining descriptor sets. Combining descriptors with similar performance and similar σ-values generally improves the overall performance. In feature level fusion, the number of latent variables selected for each group of descriptors is related to the number of latent variables for the individual experiment. In the experiment for both Shape and MOE descriptors the same number of latent variables and similar σ-values were used in the individual experiments. The data fusion model leads to an improved prediction performance for the same parameter settings. Functional Model (c) Hybrid data-decision Level Fusion Figure 2. Architecture paradigms Architecture in data fusion addresses the issue of deciding where the fusion must take place in the data flow of the whole system. Analogous with the general JDL model, three alternative auto-fusion architectures are defined for QSAR applications as illustrated in Fig. 2. A detailed description of each follows: Figure 1. Functional model of auto-fusion for QSAR • Data level fusion - Fig. 2(a) shows the combination of several sources of raw data generated by different descriptor generation algorithms, such as PEST and MOE, to produce new (raw) data. There is empirical evidence that merely concatenating multidimensional descriptors often only marginally improves the model performance. Data alignment is necessary before implementing predictive modeling for multi-source data. • Feature level fusion - as illustrated in Fig. 2(b), each descriptor generator algorithm provides calculated descriptors from which a feature vector is extracted right after the data alignment. Feature level fusion combines various feature vectors from different descriptors into a new single data set followed by a common model selection, modeling and prediction procedure. The feature extraction can be based on PCA, PLS and/or independent component analysis (ICA). • Hybrid data-decision level fusion - this architecture follows a hybrid scheme, combining data and decision level fusion as illustrated in Fig. 2(c). The procedure from beginning till model selection is identical with the data level fusion. Bagging methods as a decision level fusion method can now be incorporated in the combined new raw data set. Conclusion Similar to the JDL model, QSAR predictive modeling can be decomposed in several independent levels of functionalities as illustrated in Fig.1: • The sorted sigma value for each individual group of descriptors are Statistics (σ=5) < MOE (σ=12) = Shape (σ=12) < Histogram (σ=25) < Wavelet (σ=100) . The large σ-value used for the wavelet descriptors implies that the Wavelet descriptors have an almost linear relationship with the response. This can be validated by comparing the performance of a PLS model with a K-PLS model for the Wavelet descriptors. In this case the PLS model actually gives a better performance than the K-PLS model. • The sorted best generalization power of each model in terms of Q2 are: MOE (0.1672) > Statistics (0.2876) > Wavelet (0.3828) > Histogram (0.4562) > Shape (0.5229). • When σ < 25, K-PLS has generally better performance than PLS. This also implies that the corresponding descriptors have a nonlinear relationship with the response. • Auto-fusion method consistently yield an improved prediction performance; • Selecting specific descriptors sets to be combined is crucial for fusion systems; • Among the five generated descriptors, Statistics, MOE and Shape descriptors show a strong nonlinear relationship with the response, while the Histogram and Wavelet descriptors exhibit a linear relationship. • Level 0: Data alignment - Data standardization process with transformation of , where and are sample mean and sample standard deviation respectively; • Level 1: Feature extraction - Feature extraction algorithm and processing which extracts features from the input data and transfers to other functionalities, such as data alignment and modeling. • Level 2: Modeling - Machine learning methods used for modeling of the available data set, such as SVM, PLS and K-PLS. • Level 3: Model selection and performance estimation (MS&PE) - MS is mainly used for selecting appropriate parameters for learning algorithms in order to maximize the generalization power of the final model. Different cross-validation methods can be used for the MS task, such as leave-one-out and Bootstrap cross-validation. With respect to PE, several different performance metrics are used to assess the performance on external test data or the cross-validation sets. • Level 4: Prediction - the prediction process is mainly used for external test or prediction of unseen data. Training, validation, and test data should be handled consistently with regard to standardization, variable selection and feature extraction. Predicted results need to be restored into the original data space. References [1] Kessler, et. al.: Functional description of the data fusion process. Technical report (1992) [2] Colmenarejo, G., Alvarez-Pedraglio, A., Lavandera, J.L.: Cheminformatic models to predict binding affinities to human serum albumin. Journal of Medicinal Chemistry 44 (2001) 4370-4378 http://reccr.chem.rpi.edu/