Download
1 / 29
310 likes | 522 Vues
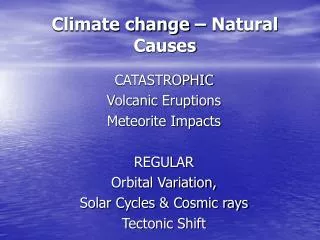
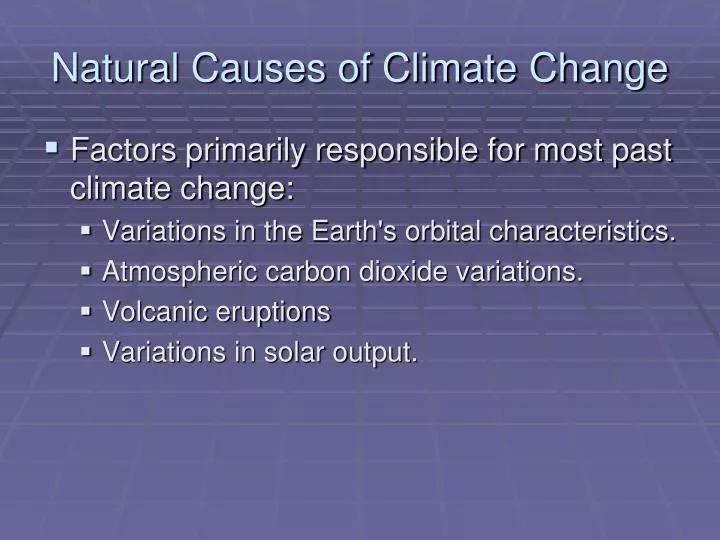
Natural Causes of Climate Change. Factors primarily responsible for most past climate change: Variations in the Earth's orbital characteristics. Atmospheric carbon dioxide variations. Volcanic eruptions Variations in solar output. Volcanoes and Gases.

E N D
Natural Causes of Climate Change • Factors primarily responsible for most past climate change: • Variations in the Earth's orbital characteristics. • Atmospheric carbon dioxide variations. • Volcanic eruptions • Variations in solar output.
Volcanoes and Gases • Volcanic gases significant impact on global change • Magma contains gases • Concentrations vary between volcanoes • Water vapor most abundant then carbon dioxide & sulfur dioxide. Others = hydrogen sulfide, hydrogen chloride, and hydrogen fluoride. • Volcanic gas, aerosol droplets, and ash injected into the stratosphere during major explosive eruptions. • Sulfur dioxide, can cause global cooling, ozone destruction, and volcanic smog or "vog".
Sulfur dioxide and Aerosols • Major impact is conversion of sulfur dioxide to sulfuric acid (H2SO4), • condenses sulfate aerosols. • aerosols increase reflection of radiation to space; cool the Earth's lower atmosphere • however, absorb heat radiated up from the Earth, warming stratosphere. • sulfate aerosols also help destroy ozone • Chemical reactions produce chlorine monoxide (ClO), which destroys ozone (O3).
Volcano Types • Non-explosive • Fluid Basaltic Lava • Basalt is rich in iron & Magnesium • Not rich in gases • High temperature eruption • Broad Volcano • Examples--Hawaiian Britannica
Explosive Volcano • Rich in Silica (SiO2) • Rich in Gases • Very Viscous • Lower Temperature Eruptions
California Explosive Volcanoes Lassen Shasta
Sampling gases Sulphur dioxide measurements with spectrometer. Mt San Helens Collecting Gas Samples at Mt. San Helens
Types of volcanic gases The most abundant gas typically released into the atmosphere from volcanic systems is water vapor (H20), followed by carbon dioxide (C02) and sulfur dioxide (S02). Volcanoes also release smaller amounts of others gases, including hydrogen sulfide (H2S), hydrogen (H2), carbon monoxide (CO), hydrogen chloride (HCL), hydrogen fluoride (HF), and helium (He). Examples of volcanic gas compositions, in volume percent concentrations(from Symonds et. al., 1994)
Mount Pinatubo • Mount Pinatubo eruption, on June 12, 1991. • one of largest eruptions of this century. • erupted over a cubic mile of rock material. • 20- million ton sulfur dioxide cloud into stratosphere to 20 miles. • largest sulfur dioxide cloud observed since satellites in 1978. • Sulfate aerosol formed in stratosphere from sulfur dioxide; increased the reflection of radiation into space. • Earth's surface cooled in the three years following the eruption, by as much as 1.3 degrees ( Fahrenheit scale) • sulfate aerosols accelerated destruction of ozone. • Some blamed Midwest floods and larger Antarctic ozone hole on Mt. Pinatubo aerosols. • some large historic eruptions followed temperature decreases. not all large eruptions followed by temperature decreases,
El Chichon www.geo.mtu.edu NOAA
Graphs of average temperatures 5 years before and 5 years after the listed various volcanic eruptions. Low temperatures always occur after an eruption (occurring at Month #0). Graph “e.” is a composite of the graphs a.–d. Graph “f.” is the response to the most recent Mt. Pinatubo eruption. (From: Climate Research Unit). http://earthguide.ucsd.edu/
Tree Rings & Eruptions • High density wood = warm temperatures, and vice versa. • lowest tree-ring densities follow major eruptions • Largest eruption, Peru 1601, caused severe economic damage in Peru and its neighbors took 150 years to recover • Severe winters, late frost, and cool summers follow major eruptions. Lead to poor harvest • Tambora eruptions = Europe spent summer around the fireplace in 1816, with frost in July, followed by famine. A list of years characterized by low tree-ring densities, with the name of the volcano eruption immediately preceding the tree-ring event indicated in parentheses (n.d. = not determined). http://earthguide.ucsd.edu/
Deccan Trap • formed between 60 and 68 million years ago,[2] • eruptions may have lasted fewer than 30,000 years. • gases released may have played a role in the Cretaceous–Tertiary extinction event,. • the original area covered by the lava flows was as large as 1.5 million km², approximately half the size of modern India. • release of volcanic gases "contributed to an apparently massive global warming. Some data point to an average rise in temperature of 8 °C (14 °F) in the last half million years before the impact at Chicxulub."[3] Naggs & Raheem
Deccan Trap • Cretaceous, associated with Dinosaur extinction • Much gas in atmosphere, warmed planet • More gas than by meteor impact thought to cause extinction Tathagata 'Ted' Dasgupta The basalt layers in India's Deccan Traps could be used to store huge amounts of carbon dioxide. DINODIA IMAGES/ALAMY
Siberian Trap - Permian • Permian about 250 mya-greatest extinction • Scant evidence for meteor impact • Gases from impact not enough for extinction • Gases from magma led to extinction?
Milankovitch Theory • Climate change due to variations in the earth's orbit - Milankovitch Theory • 1) eccentricity cycle - the earth's orbit around the sun is elliptical. • the shape of the ellipse (eccentricity) varies from less elliptical to more elliptical back to less elliptical and take about 100,000 years to complete this cycle. • currently, we are in an orbit of low eccentricity (near circular). • review - when are we closest to the sun? • Data analysis for the last 800,000 years of deep-ocean sediments show that ice coverage is a maxima every 100,000 years • this matches the Eccentricity cycle period http://www.wwnorton.com/college/geo/egeo/flash/18_2.swf
Precession cycle - • The earth wobbles about it's axis of rotation like a spinning top • one cycle = about 23,000 years • in 11,000 years, seasons will switch times during year and will be more severe...., why? http://www.wwnorton.com/college/geo/egeo/flash/18_2.swf
Obliquity • Tilt Cycle - Obliquity • axis of earth’s rotation is tilted 23.5° • However, value changes from 22.5° to a maximum of 24.5° and takes 41,000 years to complete • at 22.5° the seasonal variation will be greater/less? • at 24.5° the seasonal variation will be greater/less than current? http://www.wwnorton.com/college/geo/egeo/flash/18_2.swf
Sunspots • huge magnetic storms that show up as dark (cool) areas on the suns surface • more sunspots = more energy, = more energy on earth • warmer climate during a sun spot maximum; cooler climate during minimum. • what does a sun spot look like? • sun spot period is about 11 years
Sunspot Cycles • Sunspot minimum 1645-1715 • Period called “Little Ice Age” Images from Nasa
The solar disk seen by the Yohkoh soft-X-Ray imager, over the time period 1991-1995 (left to right), spanning the descending phase of cycle 23. Source: http://www.heasarc.gsfc.nasa.gov Solar irradiation is the amount of energy from solar radiation hitting earth’s surface.