Download
1 / 17
170 likes | 592 Vues
X-Ray Fluorescence A nalysis . by Gergana Hristozova Project supervisor: s. eng. M. Gustova FLNR. Aim of the project.

E N D
X-RayFluorescence Analysis by GerganaHristozova Project supervisor: s. eng. M. Gustova FLNR
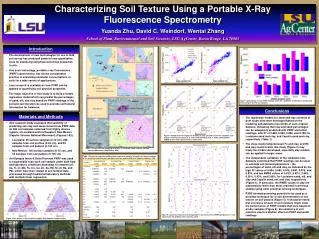
Aim of the project • To establish the content and concentration of heavy metals in soil samples. The specimens used were taken from Bulgaria. The first sample was obtained in Plovdiv, right in the center of town. The second- from a field near a metalworks, located outside of Plovdiv. • The same method can be used to determine the quantity of micro-admixtures in objects of the surrounding environment (e.g. minerals, ashes of plants, dry residua of water samples)
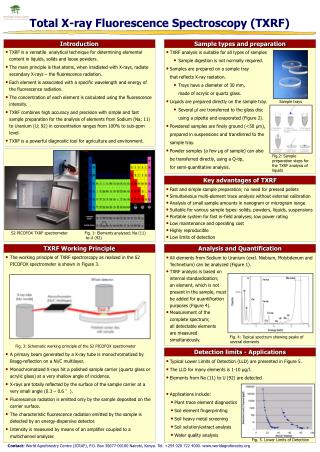
Equipment description • The multicomponent X-Ray Fluorescence analysis involves detection and measurment of the secondary emission of x-rays by the atoms of the elements in the specimen. They are being excited by gamma rays or x-rays of a standard radioactive isotope source such as Cd109 (emanation energy E =22,16keV, T1/2=453 days) or Am241 (E=59,57keV, T1/2=458y). A semi-conductive silicon /lithium spectrometer is used, with an area of about 30mm2 and thickness of 3mm.
This is a photo of the standard ring-shaped radioisotope source 109Cd (E=22,16 keV, T1/2=453 days) used for excitation of X-ray radiation. The characteristic X-ray radiation is registered using a semi-conductive Si(Li) detector with full width at half maximum (FWHM) resolution 145eV for a line of Fe (6,4 keV).
The software settings are done according to the geometry of the experiment. Sample cassette, , S=3cm2 Specimen stand Source 3mm, h=3mm Source stand Pb (protection) Al Ag (protection) Be window Si (Li) – detector
In this picture you can see the pulse-height analyzer and the analysis software being used: Canberra’s WinAxil and WinFund. And these are the two soil samples taken from Bulgaria.
The soil needs to be dried out. Both samples were put in an oven for two hours at a temperature of 1050C. Afterwards, both soil specimens were ground, put into cassettes, signed and weighed out, which concluded the preparation of the samples.
Two kinds of samples were examined. In the first picture you can see a prepared sample, put on the source. It contains 2-3g of soil put in a cassette(saturated layer specimen). The other type of specimen is actually a thin layerof the same soil, baked and ground, and stuck on a piece of tape.
The spectra of the soils display the need of having two different types of sample preparation: WinFund: Spectrum of the saturated layer, sample #1. Spectrum of the thin layer, sample #1.
Spectrum of the saturated layer, sample #2. Spectrum of the thin layer, sample #2.
Using Canberra’s Winaxil, the spectra are analyzed further. A fitting model and the chemical elements of interest are set, afterwards, the area of each peak is calculated. Spectrum of sample #1, saturated layer:
Calibration curves were used to calculate the exact values of Se, Cr and Ni concentration.
Using thin and saturated layers, and several calibrational curves, the following results were obtained: Due to the low concentration and the characteristics of elements of lower Z, not all elements of interest were found in the saturated layer of sample #1. This is why thin layer samples were used, too.
Conclusion: • The following elements were detected: Pb, Ca, Ti, Fe, Cu, Rb, Sr, Y, Zr, K, Mn, Zn, Cr, Ni, Se. • Data were analyzed in 3 different ways: • Using saturated layers and by comparison to reference samples. • Using calibration curves for elements not present in the reference samples. • Using thin layers (for elements such as K, Ca, Cr, Mn). • It was determined that the soil taken from Plovdiv (sample #1) has a standard content and concentration. • The soil taken in proximity to the metalworks (sample #2) contains more Pb than usual and should not be used for planting fruits.
Acknowledgements I would like to thank my supervisor M. Gustova and Natasha Gustova, a student at the Moscow State University in her third year, for the patience, the guidance and the help. It was a pleasure.