Download
1 / 47
470 likes | 569 Vues
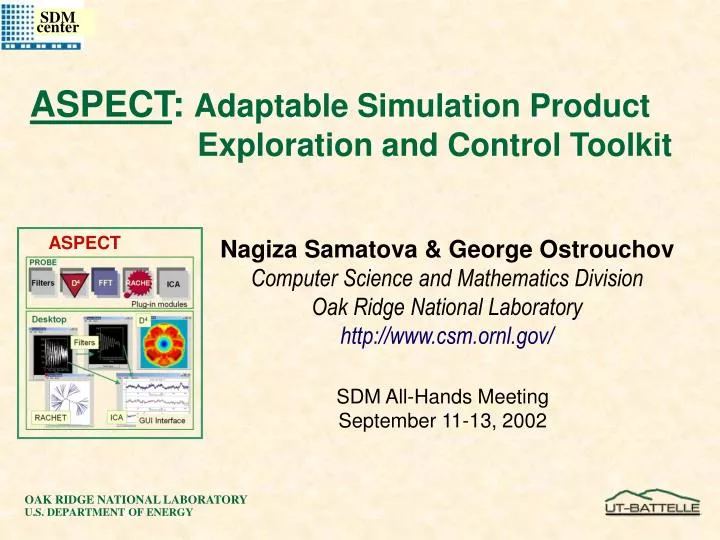
ASPECT : Adaptable Simulation Product Exploration and Control Toolkit. ASPECT. Nagiza Samatova & George Ostrouchov Computer Science and Mathematics Division Oak Ridge National Laboratory http://www.csm.ornl.gov/. SDM All-Hands Meeting September 11-13, 2002. Students:

E N D
ASPECT: Adaptable Simulation Product Exploration and Control Toolkit ASPECT Nagiza Samatova & George Ostrouchov Computer Science and Mathematics Division Oak Ridge National Laboratory http://www.csm.ornl.gov/ SDM All-Hands Meeting September 11-13, 2002
Students: AbuKhzam, Faisal, Ph.D. – University of Tennessee, Knoxville Bauer, David, B.S. – Georgia Tech Institute Hespen, Jennifer, Ph.D. – University of Tennessee, Knoxville Nair, Rajeet, M.S. – University of Illinois, Chicago Postdocs: Park, Hooney, Ph.D. Staff: Ostrouchov, George, Ph.D. – Principal Investigator Reed, Joel, M.S. Samatova, Nagiza, Ph.D.– Principal Investigator Watkins, Ian, B.S. Our Team
Application: David Erickson, Climate, ORNL John Drake, ORNL Tony Mezzacappa, Astrophysics, ORNL Linear Algebra & Graph Theory: Gene Golub, Stanford University Mike Langston, UTK Data Mining and Data Management: Rob Grossman, UIC High Performance Computing: Alok Choudhary, Wei-keng Liao: NWU Bill Gropp, Rob Ross, Rajeev Thakur: ANL Hardware and Software Infrastructure: Dan Million, ORNL Randy Burris, ORNL Our Collaborators
Typical Simulation Exploration ScenariosDriven by limitations of existing technologies • Post-processing Scenario: • Submit a long-running simulation job (weeks – months) • Periodically check the status (run “tail -f” command on each machine) • Analyze large simulation data set • Real-time Scenario: • Instrument a simulation code to visualize a field(s) • While running a simulation job • Monitor the selected field(s) • If can not monitor, then either Stop a job or Continue running without monitoring and ability to view later what has been skipped • If changing a set of fields to monitor, then go to 1
Analysis & Visualization of Simulation Product – State of the Art • Post-processing data analysis tools(like PCMDI): • Scientists must wait for the simulation completion • Can use lots of CPU cycles on long-running simulations • Can use up to 50% more storage and require unnecessary data transfer for data-intensive simulations • Real-time Simulation monitoring tools (like Cumulvs): • Need simulation code instrumentation (e.g., call to vis. libraries) • Interference with simulation run: snapshot of data => can pause simulation • Computationally intensive data analysis task becomes part of simulation • Synchronous view of data and simulation run • More control over simulation
Some More Limitations… • Post-processing data analysis tools: • Application specific (PyClimate, mtaCDF, PCMDI tools, ncview) • tools written for one application can not be used for another • usually written by experts in the application not data analysis field • Not user friendly, usually script-driven (Python, IDL, GrADS) • Support no more than a dozen of simple data analysis algorithms • Do not exist for some applications (astrophysics vs. climate) • Are not designed as distributed systems • distributed data sets must be centralized • tools must be installed where the data is • Real-time Simulation monitoring tools: • Provide even simpler data analysis (usually focused on rendering of the data) • Require good familiarity with the simulation code to make changes: • NCAR folks develop climate simulation codes (PCM, CCSM) used world-wide
Improvements through — ASPECTData stream not simulation monitoring tool Simulation Data Filters FFT ICA Tapes Disks D4 ASPECT PROBE RACHET • ASPECT’s drawbacks: • (e.g. unlike CUMULVS/ORNL) • No computational steering • No collaborative visualization • No high performance visualization Plug-in modules Desktop Filters D4 ICA RACHET GUI Interface • ASPECT’s advantages: • No simulation code instrumentation • Single data — multiple views of data • No interference w/ simulation • Decoupled from the simulation
ASPECT Disks Tapes • PROBE for Storage & Analysis of Simulation Data: • High-Dimensional • Distributed • Dynamic • Massive • Data Management Data Analysis Terascale Supernova Explosion (TSI)Simulation Computational Environment Application Scientist “Run and Render” Simulation Cycle in SciDAC: Our vision Goal: To develop ASPECT (Adaptable Simulation Product Exploration and Control Toolkit) Benefits: • Enable effective and efficient monitoring of data generated by long running simulations through the GUI interface to a rich set of pluggable data analysis modules • Potentially lead to new scientific discoveries • Allow very efficient utilization of human and computer resources
ASPECT Design & Implementation Build a Workflow Environment (Probe) Interact with Application Scientists T. Mezzacappa, R. Toedte, D. Erickson, J. Drake CS & Math Research driven by Applications Data Preparation & Processing Learn Application Domain (problem, software) Application Data Analysis Research Publications, Meetings & Presentations Approaching the Goal through a Collaborative Set of Activities
Very limited resources General purpose software only Lack of interface with HPSS Homogenous platform (e.g., Linux only) 80% => 20% Paradigm in Probe’s Research & Application driven Environment From frustrations To smooth operation • Hardware Infrastructure: RS6000 S80, 6 processors 2 GB memory,1 TB IDE FibreChannel RAID 4-processor (1.4 GHz Xeon) 8 GB 5*73GB, FibreChannel HBA and GigE two 2-processor (2.4 GHz Xeon), 2 GB, 5*73 GB, GigE, FibreChannel HBA • Software Infrastructure: Compilers (Fortran, C, Java) Data Analysis (R, Java-R, Ggobi) Visualization (ncview, GrADS) Data Formats (netCDF, HDF) Data Storage & Transfer (HPSS, hsi, pftp, GridFTP, MPI-IO, PVFS)
NERSC Chiba City Probe ASPECT Server ASPECT Server ASPECT Server UIC DataSpace Server PVFS PVFS PVFS HPSS HPSS HPSS Archival data Request Request ASPECT GUI Client Data Data Probe XML Request Builder Viz. Engine Data Restore DataSpace Server User Data Reduction Data Analysis Data I/O Archival data Data Preprocessing ASPECT InfrastructureDistributed End-to-End System
NetCDF Reader Menu of Modules • Categories: • Data Acquisition • Data Filtering • Data Analysis • Visualization Create Instance Link Modules <modules> <module-set> <name> Data Acquisition </name> <module> <name> NetCDF Reader </name> <code> datamonitor.NetCDFReader </code> </module> </module-set> <module-set> <name> Data Filtering </name> <module> <name> Invert Filter </name> <code> datamonitor.Inverter </code> </module> </module-set> </modules> Link Modules FFT Visualization Module Filter Module XML Config File ASPECT GUI Infrastructure • Functionality: • Instantiate Modules • Link Modules • Synchronous Control • Add Modules by XML • XML-based Request Builder
ASPECT Back-End Engine Overview Engine Front End (Takes Request from GUI, reads input into memory) The GUI passes a string indicating the script to run, the variables to pass to the script, the names of the files (or groups of files) where those variables can be found, and other optional parameters. The engine parses the string, reads all of the data into R compatible objects (in memory), and then calls the script through R. When R returns, the single returned object is broken up into respective variables, and written to a NetCDF file. R Script (Translates input to R function call) GUI R (Performs calculations) Engine Back End (Converts R’s Output to NetCDF file)
Interfacing with R:ASPECTprovides a rich set of data analysis modules through R • Status: • Release under GPL in Source Forge, September, 2002 • Includes about 30 algorithms • A dozen can be added in a matter of a week • Requested by DataSpace, UIC • Joint effort w/ DataSpace http://www.r-project.org/ The open source R statistical package provides the generic computational backend for the ASPECT engine. While R was designed to be mostly a stand-alone program, it does provide for internal hooks in its libraries. Using the same functions, macros, and syntax available to internal R code, the ASPECT engine creates R objects from the input data directly. These objects are then installed in the namespace of the R engine, and used by the R wrapper scripts as if it were running in an ordinary R environment.
Scripts … Using R script wrappers to the R functions allows for an incredible amount of flexibility. Users can easily add their own functions, without having to know the internals of the ASPECT engine. Most of the scripts, like the one below, simply translate the C input into the equivalent R function call. wsample <-function(x1, x2, v1, v2, n1, n2, c1, c2) { a <- if (n2 != 0) TRUE else FALSE q <- if (!is.null(v2)) ( if (n1 != 0) sample(v1, size = n1, replace = a, prob=v2) else sample (v1, replace = a, prob = v2) ) else ( if (n1 != 0) sample (v1, size = n1, replace = a) else sample (v1, replace = a) ) list( Sample = q) } The scripts can be as complicated or simple as they need to be. The below script is perfectly valid. whello <-function(x1, x2, v1, v2, n1, n2, c1, c2) { print("Hello World") }
XML-based Description of Algorithms and Visualization Interfaces <name> wsort </name> <displayName> Sort </displayName> <input> <variable> <type> vector </type> <name> data </name> <description> The input data </description> </variable> <variable> .... • Dynamically loaded XML descriptions of functions and menus provide user expandable configuration details. • Users can add comments, change default values, add multiple interfaces to a single function, and add interfaces for their own functions.
NetCDF/HDF Input/Output:ASPECT understands and uses scientific standard file formats http://www.unidata.ucar.edu/packages/netcdf/ The open source NetCDF format is widely used to hold self-describing data. The output from the R engine is a single R object. Given the recursively defined list nature of R objects, this is no limitation. In order to save a dynamic R object into a flat NetCDF file, the object must be carefully unwound, while preserving as much of the metadata (such as dimension names, the original source of the data, etc) as possible into the NetCDF file. Once the output file is written, it is ready to be used by the user either for visualization, or as the input to another function.
MPI-IO NetCDF ASPECT supports parallel I/O w/ various data access patterns(Collaboration with ANL (Bill Gropp, Rob Ross, Rajeev Thakur) and NWU (Alok Choudhoury, Wei-keng Liou) • Concatenate multiple files into a single file for a given set of variables • Analyze multiple files with different data distribution patterns among processors (by blocks, by strided patterns, by entire files)
Data Sampling ASPECT handles large data sets Types of Subsampling: • Random subsampling • Decimation • Blocks • Striding Implementations: • Standard netCDF • MPI-IO netCDF
ASPECT Interfacing with DataSpaceASPECT provides “hooks” to a Web of Scientific Data(Collaboration with Bob Grossman at UIC) The web today provides an infrastructure for working with distributed multimedia documents. DataSpace is an infrastructure for creating a web of data instead of documents. • Very high throughput for moving data through DataSpace’s parallel network transport protocols (Psockets (TCP), Sabul (TCP, UDP)) • Ability to do comparative/correlation analysis between simulation and archived data DataSpace – Web of Data PSockets/Sabul UIC – Amsterdam: Sabul – 540 Mb/s Psockets – 180 Mb/s Sockets – 10Mb/s http://www.dataspaceweb.net
Summary of ASPECT’s Design & Implementation • ASPECT is a Data Stream Monitoring Tool • ASPECT has very nice features for efficient and effective simulation data analysis: • GUI interface to a rich set of pluggable data analysis modules. • Uses the open source R statistical data analysis package as a computational back-end. • Understands and uses the NetCDF/HDF scientific file format. • Uses dynamically loadedR scripts and XML descriptors for flexibility. • Handles large sets of data through the support for block selection, striding, sampling, data reduction, and distributed algorithms. • Provides efficient I/O through MPI-IO interface to NetCDF and HDF • Moves data efficiently through PSockets/Sabul • Supports dataset view of the simulation not only a collection of files
Supernova Explosion:1-D simulation: 2GB 2-D simulation: 1TB 3-D simulation: 50TB Simulation Data Sets are Massive & Growing Fast Astrophysics Data per Run
Most of this Data will NEVER Be Touched with the current trends in technology • The amount of data stored online quadruples every 18 months, while processing power ‘only’ doubles every 18 months. • Unless the number of processors increases unrealistically rapidly, most of this data will never be touched. • Storage device capacity doubles every 9 months, while memory capacity doubles every 18 months (Moore’s law). • Even if the divergence between these rates of growth will converge, the memory latency is and will remain the rate-limiting step in data-intensive computations • Operating systems struggle to handle files larger than a few GB. • OS constraints and memory capacity determine data set file size and fragmentation
Massive Data Sets are Naturally Distributed BUT Effectively Immoveable (Skillicorn, 2001) • Bandwidth is increasing but not at the same rate as stored data • There are some parts of the world with high available bandwidth BUT there are enough bottlenecks that high effective bandwidth is unachievable across heterogeneous networks • Latency for transmission at global distances is significant • Most of this latency is time-of-flight and so will not be reduced by technology • Data has a property similar to inertia: • It is cheap to store and cheap to keep moving, but the transitions between these two states are expensive in time and hardware. • Legal and political restrictions • Social restrictions • Data owners may let access data but only by retaining control of it Computations MUST move to data, rather than data to computations
Stream of climate simulation data t=t0 t=t1 t=t2 new new Incremental update via fusion Simulation Data Sets are Dynamically Changing • Scientific simulations (e.g., climate modeling and supernova explosion) typically run for at least one month and produce data sets in the order of one to ten terabytes per simulation. • Effectively and efficiently analyzing these streams of data is a challenge: • Most existing methods work with static datasets. Any changes require complete re-computation. Computations MUST be able to efficiently analyze streams of data while they are being produced, rather than wait until they are produced
Algorithms Fail for a Few Gigabyte Data Data size, n Algorithm Complexity n nlog(n) n2 100B 10-10sec. 10-10 sec. 10-8 sec. 10KB 10-8 sec. 10-8 sec. 10-4sec. 1MB 10-6 sec. 10-5 sec. 1 sec. 100MB 10-4 sec. 10-3 sec. 3 hrs 10GB 10-2 sec. 0.1 sec. 3 yrs. Algorithmic Complexity: Calculate means O(n) Calculate FFT O(n log(n)) Calculate SVD O(r • c) Clustering algorithms O(n2) For illustration chart assumes 10-12 sec. calculation time per data point
RACHET High Performance Framework for Distributed Cluster Analysis RACHET |S|<<N O(N) Strategy Perform data mining in a distributed fashion with reasonable data transfer overheads Key idea Compute local analyses using distributed agents Merge minimum info into a global analysis via peer-to-peer agents’ collaboration & negotiation Benefits NO need to centralize data Linear scalability with data size and with data dimensionality
Stream of simulation data t=t0 t=t1 t=t2 new new Incremental update via fusion Linear Time Dimension Reduction for Streamline & Distributed Data • Status: • C, MPI, MPI-IO based implementation of package • Both one time and iterative communication • Integration into ASPECT is in progress • Requested by DataSpace, UIC; P3 project (Ekow), LBL • Features: • One time communication • Linear time for each chunk • ~10% deviation from central version • Based on FastMap
Ratio # of Data Sets Performance of Distributed PCA vs. Monolithic PCA Distributed Principal Components (PCA) Merging Information Rather Than Raw Data • Global Principal Components • transmit information, not data • Dynamic Principal Components • no need to keep all data Method: Merge few local PCs and local means • Benefits: • Little loss of information • Much lower transmission costs: • Centralized O(np) • DPCA O(sp), s<<n • Computation cost: • O(kp2) vs O(np2)
Data Understanding for Scientific Discovery
Data Analysis for Monitoring Simulations • What do we monitor? • Contrast between Supernova and Climate simulation data analysis • Highlights from Astrophysics • Wider implications on simulation data • Data reduction and monitoring from reduced data
What Do We Monitor? Entropy of 2-d (axisymmetric) Supernova Simulation • General Concepts • Application-specific • comparative displays driven by data mining and exploratory data analysis • Visual comparison in time is less effective than comparison side-by-side (Visual Display of Quantitative Information, Tufte)
Median along layer Evolving Display Shows Entropy Progression over Time Radius Time Reduction with median
Range along layer Specific Aspects of Simulation Can be Monitored Entropy instability (range) over time Radius Time Reduction with range (max – min)
Archived Run Active Run Time Time Shorten the Experimental Cycle with Run-and-Render Comparative Monitoring Radius Radius
Views evolve through time • Comparison with archived run possible • New 2-d vs. 3-d • comparison Angle Radius Radius Angle Time Time Three orthogonal views of entropy variation in a 400 time-step 2-d supernova simulation are shown with polar coordinates presented as Cartesian. Concise Views of a Supernova Simulation • Displays must be application-specific, but some general concepts apply • Need general data mining capability for flexibility in building displays
Data Reduction for Multigrid Simulation • Based on PCA of contiguous field blocks • Exploits spatial correlation and adapts to complexity of spatial field • Parameter controls selected % variation • Field restoration with single matrix multiply • Astrophysics supernova simulation: • 16 to 200 times reduction per time step • Outperforms subsampling 3 times for comparable MSE over all time steps Timestep 390
Spherical Symmetry Medians Conserved under PC Compression Original Data 30x Compressed Data Time Time
Spherical Symmetry Instability Ranges Conserved under PC Compression Original Data 30x Compressed Data Radius Radius Time Time
Conference • Co-sponsored Statistical Data Mining Conference, June 22-25, 2002, in Knoxville jointly with the University of Tennessee Department of Statistics • Organized an invited session on Distributed Data Mining at the conference.
Publications FY 2002 Y. M. Qu, G. Ostrouchov, N. F. Samatova, and G. A. Geist (2002). Principal Component Analysis for Dimension Reduction in Massive Distributed Data Sets. Workshop on High Performance Data Mining at the Second SIAM International Conference on Data Mining, p.4-9. N.F. Samatova, G. Ostrouchov, A. Geist, A. Melechko. “RACHET: An Efficient Cover-Based Merging of Clustering Hierarchies from Distributed Datasets”, Special Issue on Parallel and Distributed Data Mining, International Journal of Distributed and Parallel Databases: An International Journal, 2002, Volume 11, No. 2, March 2002. F. N. Abu-Khzam, N. F. Samatova, G. Ostrouchov, M. A. Langston, and A. G. Geist (2002). Distributed Dimension Reduction Algorithms for Widely Dispersed Data, Fourteenth IASTED International Conference on Parallel and Distributed Computing and Systems. Accepted. G. Ostrouchov and N. F. Samatova (2002). On FastMap and the Convex Hull of Multivariate Data. In preparation. J. Hespen, G. Ostrouchov, N. F. Samatova, and A. Mezzacappa (2002). Adaptive Data Reduction for Multigrid Simulation Output. In preparation.
Presentations FY 2002 Invited G. Ostrouchov and N. F. Samatova. Multivariate Analysis of Massive Distributed Data Sets. Spring Research Conference on Statistics in Industry and Technology May 20-22, 2002, Ann Arbor, Michigan. G. Ostrouchov and N. F. Samatova. Combining Distributed Local Principal Component Analyses into a Global Analysis, C. Warren Neel Conference on Statistical Data Mining and Knowledge Discovery, June 22-25, 2002, Knoxville, Tennessee. N. Samatova, G. A. Geist, and G. Ostrouchov, “RACHET: Petascale Distributed Data Analysis Suite”, SPEEDUP Workshop on Distributed Supercomputing Data Intensive Computing, March 4-6, 2002, Badehotel Bristol, Leukerbad, Valais, Switzerland Contributed Y. M. Qu, G. Ostrouchov, N. F. Samatova, and G. A. Geist. Principal Component Analysis for Dimension Reduction in Massive Distributed Data Sets. Workshop on High Performance Data Mining at the Second SIAM International Conference on Data Mining, April 11-13, 2002, Washington, DC. Local N. Samatova and G. Ostrouchov. Large-Scale Analysis of Distributed Scientific Data. ORNL Weinberg Auditorium, July 11, 2002.