Download
1 / 36
360 likes | 370 Vues
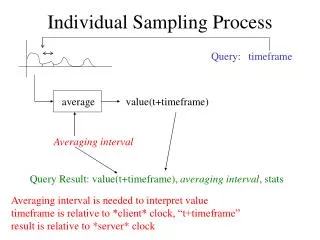
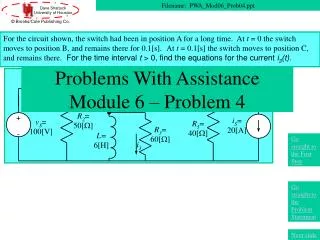
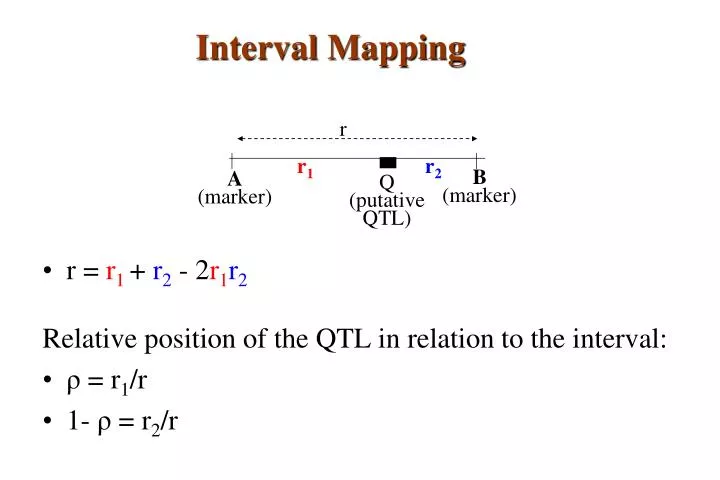
Interval Mapping. r = r 1 + r 2 - 2 r 1 r 2 Relative position of the QTL in relation to the interval: ρ = r 1 /r 1- ρ = r 2 /r. r. r 1. r 2. B (marker). A (marker). Q (putative QTL). Interval mapping of QTL using backcross progeny. r. Q. B. A.

E N D
Interval Mapping • r = r1+ r2 - 2r1r2 Relative position of the QTL in relation to the interval: • ρ = r1/r • 1- ρ = r2/r r r1 r2 B (marker) A (marker) Q (putative QTL)
Interval mapping of QTL using backcross progeny r Q B A • Parents: AAQQBB x aaqqbb • Backcross: AaQqBb x AAQQBB Expected Frequency • BC Progeny AAQQBB, AaQqBb 0.5 (1 - r) AAQqBb, AaQQBB 0.5r1 AAQQBb, AaQqBB 0.5r2 AAQqBB, AaQQBb 0 q r1 b a r2 r: recombination fraction between A and B r1: recombination fraction between A and Q r2: recombination fraction between Q and B
Interval Mapping analysis r r1 r2 B (marker) A (marker) Q (putative QTL) • - Likelihood approach (Lander and Botstein, 1989) • Linear regression approach (Knapp et al., 1990) • Non-linear regression approach (Knapp et al., 1992)
A likelihood approach using backcross progeny (cont.) Logarithm of the likelihood of the theoretical distribution: Under the H0: µ1 - µ2 = 0, the logarithm of the likelihood is: G-statistics Likelihood ratio test statistics (LR) Probability of occurrence of the data under the null the hypothesis
Likelihood mapsPlot of likelihood-ratio statistics as function of map position of the putative QTLLikelihood ratio test statistic (LR)Likelihood of odds (LOD score)LR=4.605LOD LOD= 0.217LR
Interval Mapping (by Maximum Likelihood) • Lander and Botstein (1989) • Tests positions at and between markers / one-dimensional search, interactions between multiple QTL are not considered • Accounts for mixtures of QTL genotypes in each marker class. • Find position that maximizes LR
Interval MappingLimitations • Assumes a single segregating QTL influencing the trait • The number of QTLs cannot be resolved (linked QTLs?) • The locations of the QTLs are sometimes not well resolved and the exact position cannot be determined (QTL interactions?) • The statistical power is still relatively low (limited information in the model)
Composite Interval Mapping (CIM) Combination of simple interval mapping and multiple linear regression Genetic markers are incorporated as co-factors in the framework of simple interval mapping Co-factor markers partially absorb genetic variance associated with unlinked and linked markers and greatly increase the power for detecting QTL and estimating QTL positions Zeng (1994), Jansen and Stam (1994)
Composite Interval Mapping (CIM) Problems with CIM: • Highly dependent on background markers • Permutations to calculate threshold are slow (QTL Cart)
Mapping QTL in multiple environments • QTL positions are assumed to be constant • QTL Effects may vary by environment • Need to test multiple environments to know this • This adds complexity to the QTL analysis • One solution: separate analyses
Mapping QTL in multiple environments Better: analysis across environments Software: NQTL
Multiple interval mapping (MIM) - MIM uses multiple marker intervals simultaneously to fit multiple putative QTL directly in the model for mapping QTL - MIM is based on Cockerham’s model for interpreting genetic parameters - MIM is based on maximum likelihood for estimating genetic parameters - Identifies: number of QTL, genomic positions, effects and interactions of significant QTL and their contribution to genetic variance
Issues in QTL detection • False positives / false negatives • Significance thresholds • Confidence interval • Population size and marker density • QTL resolution • What are QTLs? • QTL software • Applications of QTL mapping
False positives / false negatives • Ho: no association between markers and QTL Type 1 error: false positives Type 2 error: false negatives Define probability of false positives –significance level- is controlled by choosing the appropriate significance threshold
Significance Thresholds by Permutation • Churchill and Doerge, 1994 • Permute the data (create the null hypothesis) • H0: there is no QTL in the tested interval H1: there is QTL in the tested interval • Perform interval mapping • 3. Repeat (1) and (2) many times • Choose Threshold
Significant thresholds by empirical calculations QTL threshold calculations Piepho, 2001; Van Ooijen, 1999 LOD scores of 2.5 to 3.5 are commonly used LOD score of 2 indicates that the model containing the estimated QTL effect is 102= 100 times more likely than is the model with no QTL effect.
Maximum value of LOD: 4.2 3.2 3.2 Confidence interval for QTL positions Typically, confidence intervals for QTL positions have been based on a “1-LOD support interval” or a “2-LOD support interval” Example of a “1-LOD support interval” Size of the interval: (cM at *) – (cM at$) * $ As Kearsey and Farquhar (1998) note, most QTL confidence intervals are quite large, typically on the order of 20 cM.
Population size and markers density • - For an initial QTL study, generate a ”framework” DNA marker map with loci sampled every 20-30 cM. • Approaches for reducing the size of a mapping population: • -Random sampling • -Selective genotyping • -Selective phenotyping • The number of individuals needed for mapping might depend on the heritability of the trait • Replication and environments vs. Population size • Relative costs for genotypic and phenotypic analyses
The Toluca Valley, Mexico (TVM) B47 (14.6%) Bar (78.1%) 35 30 25 20 Number of lines 15 10 5 0 0 10 20 30 40 50 60 70 80 90 100 Disease severity (%) Approaches for reducing population size • Random sampling • Data sets genotyping and analysis • Selective genotyping • Selective phenotyping phenotyping and analysis
Effect of population size on the estimation of QTL number Trait: Barley stripe rust (Puccinia striiformis f. sp. Hordei) severity Vales et al., 2005
Effect of population size on the estimation of percentage of phenotypic variance explained Trait: Barley stripe rust (Puccinia striiformis f. sp. Hordei) severity Vales et al., 2005
Fine mapping and QTL cloning • - Near isogenic lines • Development of large mapping populations • Fine-map of the regions of interest (more markers, larger population, more recombination) - Positional cloning - Transposon tagging - Candidate gene Positional cloning approach. Paterson (1998)
Dissecting QTL using microarrays Genetical Genomics – Jansen and Nap, 2001 ELP: expression level polymorphism (Doerge 2002) QTL ‘eQTL” analysis Microarray ‘eTraits’ Limitations: - Changes in gene expression may not be attributable to allelic variation -Only detect changes in expression level - Availability of arrays http://www.med.upenn.edu/microarr/array.html
QTL analysis software For more information, check: http://www.stat.wisc.edu/~yandell/qtl/software/
QTL databases Gramene QTL Database http://www.gramene.org/qtl/index.html QTL for agronomic traits in rice, maize, barley, oat, sorghum, pearl millet, foxtail and wild rice.
QTL databases Graingenes: http://www.graingenes.org/cgi-bin/ace/browse/graingenes?class=QTL http://rye.pw.usda.gov/cmap/ MaizeGBD: http://www.maizegdb.org/qtl.php Summary of published barley QTL reports: http://barleyworld.org/northamericanbarley/qtlsummary.php
Use of QTL information in Improvement programs • Genotype building - Pyramiding - major genes - minor genes - major and minor genes • Introgression • Recurrent selection • Crossbreeding or hybrid production - Choice of breeds or lines to cross
Marker assisted selection • Marker-assisted selection • Marker-aid selection • Positive selection • Negative selection • Selection by design
Marker assisted selection Pyramiding: BCD populations Cali-sib x Bowman Shyri x Galena CI10587 x Galena BSR-45 D1-72 D3-6 Harrington Baronesse Orca BCD DB BCD47 BCD12 D3-6/B23 D3-6/B61 AJO BU OPS
Marker assisted selection Introgression, Backcrossing and Pyramiding • BISON: Baronesse near isogenic lines • BISON 1H, BISON 4H, BISON 5H, and combinations • For research purposes • Evaluation of disease components • Lession size, sporulation rate, pustule density • For breeding purposes Baronesse 1H BISON 1H Richardson et al. 2006