Download
1 / 23
240 likes | 479 Vues
Infrared Spectroscopy of the Atmosphere using the FTIR Spectrometer. Brian Echevarria Jennifer Link Introduction to Atmospheric Instrumentation (ATMS 360) University of Nevada Reno. FTIR. F ourier T ransform I nfra R ed

E N D
Infrared Spectroscopy of the Atmosphere using the FTIR Spectrometer Brian Echevarria Jennifer Link Introduction to Atmospheric Instrumentation (ATMS 360) University of Nevada Reno
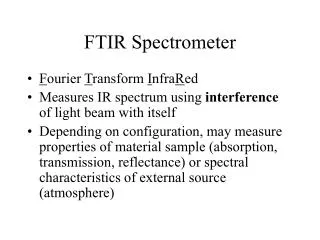
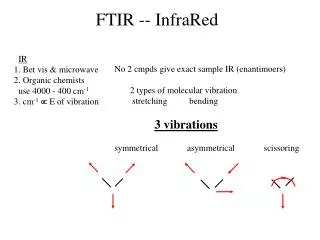
FTIR Fourier Transform InfraRed The FTIR Spectrometer is an optical instrument used to measure infrared spectra from 5 microns to 20 microns. Interested in the window region from about 13 microns to 8 microns (800cm-1 – 1300cm1)
Applications • Obtains Infrared spectrum of absorption, emission, and photoconductivity of: • Solids, liquids and gases • Identification of Cloud base temperatures • Identification of inorganic compounds and organic compounds • Measures solar irradiance • In Remote sensing
How the FTIR works • The FTIR spectrometer uses a Michelson Interferometer setup that consists of: • A beam splitter, a fixed mirror, and a mirror that translates back and forth. Cold and hot black Bodies are for calibration In order to get correct cloud Radiance and Brightness Measurements.
Calibration Circulation Water In Circulation Water Out Cone Thermistor Probe Black Paint
Calibration • j Cold Black Body Mirror Detector Hot Black Body
Cold Black Body Entered Cold BBT: -6C Generated Cold BBT: -5.9C
Hot Black Body Entered Hot BBT: 44.16C Generated Hot BBT: 44.19C
Data Collection Radiance: H2O
Data Collection Brightness Temperature: • Cloud Base Temperatures • Comparing surface temperature/moisture conditions
. Lidar Cloud height@ 1700: 5300m Sounding LCLH@1700: 5610m
“Mostly Clear”- April 12, 1648 Surface Temperature@ 1648: 9C Sounding Surface Temp@ 1700: 10C
No significant clouds detected by The Lidar for 1648. Generally clear from 1645 to 1700
Altostratus- April 17, 16:36 Base Cloud Temperature@ 1636: -15C Sounding LCLT @ 1700: -11C
Compare the Cloud Height with the Lidar and the Cloud temperature with The brightness temperature Lidar Cloud height@ 1636 : 4800m Lidar Cloud height@ 1700: 4300m Sounding LCLH@1700: 4400m
Stratocumulus- April 19, 16:58 Cloud Base Temperature@ 1658: -2C Sounding LCLT @ 1700: -1C Brightness Temperature
Lidar Cloud height@ 1658 : 2400m Sounding LCLH@1700: 3800m
Little to no CFC detection No Ozone detection
Errors in Data • Cold and Hot black body temperatures. • Quickly fluctuating hot and cold black body temperatures. • Not a completely clear day for comparison. • Sounding Location.
Conclusion • Evidence of stratospheric greenhouse gases and surface gases. • Determine cloud base temperature and height and compare with Lidar and sounding data. • Further analyze unknown gases in data.


![Fourier transform infrared spectroscopy[FTIR]](https://cdn1.slideserve.com/2743434/fourier-transform-infrared-spectroscopy-ftir-dt.jpg)