Download
1 / 33
330 likes | 438 Vues
Compass Math Test Validity April 2011. Mike Orkin, Jo Ann Phillips, Hui Zhang Office of Institutional Research Peralta Community College District. Compass Math Test. Peralta students take assessment tests for placement into Math, ESL, and English courses.

E N D
Compass Math Test Validity April 2011 Mike Orkin, Jo Ann Phillips, Hui Zhang Office of Institutional Research Peralta Community College District
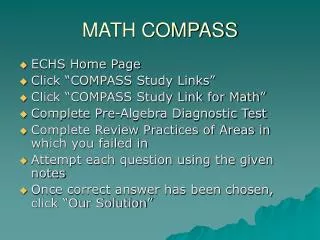
Compass Math Test • Peralta students take assessment tests for placement into Math, ESL, and English courses. • Course placement based on test scores is recommended not mandatory. • A student may take courses without taking placement tests.
Compass Math Test • Peralta uses the ACT Compass test for math placement. • When students take Compass, they advance through “subtests” until they reach a “placement domain.” • The higher the placement domain, the higher the difficulty level of the recommended courses.
Data • Students taking Compass-designated math courses in F08, S09, F09, S10. • Took Compass test immediately preceding semester when they took math course, or • Never took Compass test prior to semester when they took math course.
Data Totals • 12,657 student enrollments. • 4,915 (39%) took Compass test. • 7,742 (61%) did not.
Placement Domains and Key Courses • MPRAL – Prealgebra • Arithmetic – Math 250 (0-32) • Pre-Algebra – Math 253 (33-39) • Elementary Algebra – Math 201 (40-100)
Placement Domains and Key Courses • MALGE – Algebra. • Elementary Algebra – Math 201 (0-34) • Intermediate Algebra – Math 203 (35-49) • Statistics – Math 13 (50-100)
Placement Domains and Key Courses • MTRIG – Trigonometry. • Trigonometry – Math 50 (0-45) • Pre Calculus – Math 1 (46-100)
Placement Domains and Key Courses • MCOAL – College Algebra. • Statistics – Math 13 (0-34) • Pre Calculus – Math 1 (35-49) • Calculus – Math 3A (50-100)
Compliance Within Placement Domain • Most complied with cutoff score assignment within their placement domain.
Validity • A test is “valid” if it measures what it’s supposed to measure. • We looked at this in two ways: • Are grades and success positively related to Compass scores? • Do students who take Compass do “better” than students who don’t take Compass?
Validity • Are grades positively related to Compass scores? • Analysis of Variance (ANOVA) determines if there are significant differences in average Compass scores across course grades. • On average, as grades increase, so do scores.
Validity ANOVA - Assessment test averages by grade.
Validity Grade Counts
Validity • Do assessment test scores predict a student’s chance of success (C or better) in a course? • Logistic regression estimates the probability of success for a given assessment test score. • For all subtests, as scores get higher, the predicted chance of success increases, indicating predictive validity.
Perfect Success • We have shown that the chance of success increases as Compass scores increase. • However, if the assessment process works perfectly, there will be an appropriate course for every student, even those who get low Compass scores, and so everyone (or almost everyone) will succeed, regardless of their Compass score.
Perfect Success • If everyone succeeds, the chance of success will be 100% no matter what the Compass score, and so the regression analysis will not be meaningful. • In the same way, if there is an appropriate course for everyone, and if everyone succeeds, there will be no low grades, and, more generally, there won’t be a relationship between Compass scores and grades.
Perfect Success • In other words, looking for a relationship between Compass scores and success can be clouded by too much success. • It thus becomes useful to compare those who take the Compass test and those who don’t.
Compass v. no Compass • Do students who take the Compass test do better than students who don’t take the test? • Assume that those who don’t take the Compass test essentially select a class at random.
Compass v. no Compass • For non-Compass students, just by chance, some strong students will take lowest-level courses (too easy) and some weak students will take higher level courses (too difficult). • If Compass is properly assessing students, only weaker students will take lowest level courses and stronger students will take higher level courses.
Compass v. no Compass • Thus, students who take Compass should do worse than those who don’t at lowest subtest and better than those who don’t at higher levels. • This is exactly what we observe in the data.
Compass v. no Compass Chi Square - Success – Compass Test v. No Test
Compass v. no Compass • Similar result when comparing grades of students who take Compass with those who don’t.
Compass v. no Compass ANOVA - Test v. No Test Course GPA
Summary • All four methods of analysis yield statistically significant results supporting Compass validity.
Summary • On average, as grades increase, so do Compass scores. • As Compass scores increase, the predicted chance of success increases. • Students who take Compass do better than those who don’t in the higher subtests and worse in the lowest subtest, in both course success and grades.