Download
1 / 12
120 likes | 211 Vues
Mapping the WTP Distribution from Individual Level Parameter Estimates. Matthew W. Winden University of Wisconsin - Whitewater WEA Conference – November 2012. Motivation.

E N D
Mapping the WTP Distribution from Individual Level Parameter Estimates Matthew W. Winden University of Wisconsin - Whitewater WEA Conference – November 2012
Motivation • Heterogeneity exists in respondents’ preferences, WTP, and error variances within the population (Lanscar and Louviere 2008) • Traditional Models Used in Non-Market Valuation Impose Distributional Assumptions About Preference Heterogeneity in the Population (Train 2009, Revelt and Train 1999) • Top-Down Modeling (Mixed Logit, Latent Class Logit) • Misspecification May Lead to Bias in Parameter, Marginal Price (MP), and Willingness-To-Pay (WTP) Estimates • Leads to inefficient policy analysis and recommendations Matthew Winden, UW - Whitewater
Previous Work • Louviere et al. (2008) estimate individual level parameters using conditional logit estimator (no welfare analysis) • Convergence issue 1: Collinearityof attributes • Convergence issue 2: Perfect Predictability • Cognitive Burden (Number of Questions/Attributes) • Louviere et al. (2010) • Best-Worst Scaling As Solution • Individual Models = “Bottom-Up Modeling Approach” Matthew Winden, UW - Whitewater
Top-Down Versus Bottom-Up “Top-Down” “Bottom-Up” Assume (, ) Estimate Derive Derive Estimate Matthew Winden, UW - Whitewater
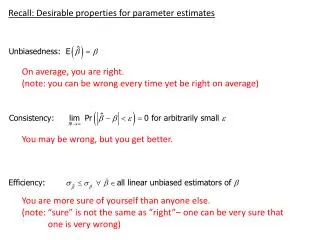
Contributions • Objective 1: Use Monte-Carlo Simulation to Provide Evidence of the Validity of Individual Level Estimation Techniques • Objective 2a: Estimate Traditional and Individual Level Models on a Stated Preference Dataset • Eliminates Collinearity as a Convergence Problem • Objective 2b: Estimate Traditional and Individual Level Models on a Revealed Preference Dataset • Objective 3: Use Individual Level Estimates to Demonstrate Potential Bias Resulting from Distributional Assumptions in Traditional Models Matthew Winden, UW - Whitewater
Traditional Mixed Logit P(j|vi) = exp(Uji)/Σexp(Uji) Utility of choice j for respondent i: = αji + Βj+ ΦjZji + ΘjiWji where: αji= alternative-specific constant Βj= vector of fixed coefficients Χi= fixed individual characteristics Φj= vector of fixed coefficients Θj= vector of varying coefficients Zji& Wji = choice-varying attributes of choices Matthew Winden, UW - Whitewater
Individual Level Simulation & Estimation Strategy • 3 Datasets (A, B, C) • Known parameter, attribute, and error distributions • 100 respondents, 100 choice scenarios • Face 3 attributes (X1 & X2 - Uniform, X3 – Zero, Status Quo) • Face 3 alternatives (Respondent Specific Error Term to Each Alternative) • Have 3 individual specific betas for each of the three attributes • Simulation A • Beta 1 = Normal, Beta 2 = Normal, Beta 3 = Normal • Simulation B • Beta 1 = Normal, Beta 2 = Normal, Beta 3 = Uniform • Simulation C • Beta 1 = Normal, Beta 2 = Normal, Beta 3 = Exponential Matthew Winden, UW - Whitewater
Individual Level Model Simulation • Results: • LL for Individual Level Models Indicates Better Fit than Correctly Specified Mixed Logits • Comparing True X3βValues, the Individual Level Model Performs Well Under All Distributional Specifications for the X3 Attribute Matthew Winden, UW - Whitewater
Traditional and Individual Model Comparisons • Results: Table 34: Willingness-To-Pay Estimates ($/Gal) Matthew Winden, UW - Whitewater
Conclusions? (So-Far) • Result 1: Validity of Individual Estimation Demonstrated through Simulation Kind Of... • Result 2: Individual Level Model Distributions, MPs, & WTPs Differ Significantly from Outcomes Using Traditional Models • Role of Including or Excluding Individuals with Statistically Significant (but possibly Lexicographic) Preferences on Estimates • Role of Including or Excluding Individuals with Statistically Insignificant values (Round to Zero?) • Result 3: Without knowing underlying distribution, may inadvertently choose incorrect mixing distribution based on LL Matthew Winden, UW - Whitewater
Extensions • E1: True (Full) Monte-Carlo Simulation For Individual Level Specifcations • Vary Over Number Respondents, Number Choice Occasions, Number Attributes, Types of Distributions • E2: Comparison using Revealed Preference Dataset (Beach) • Introduced Potential Collinearity as a Convergence Issue • More Realistic Situation Under Which Heterogenity May Matter • E3: Develop Appropriate Significance Tests for Individual Level Models • E4: Scale Issues in Aggregation of Individual Respondents Matthew Winden, UW - Whitewater