Download
1 / 40
400 likes | 547 Vues
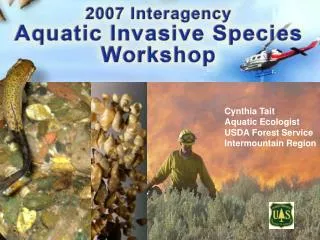
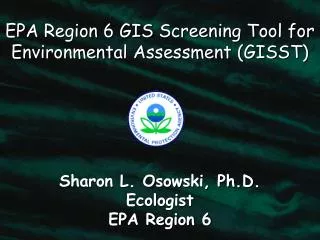
Geospatial Tools in Action: EPA Region 6 GIS Screening Tool for Environmental Assessment and the Texas Ecological Assessment Protocol. Sharon L. Osowski, Ph.D. Ecologist EPA Region 6. R6 Office of Planning & Coordination. NEPA Compliance Team.

E N D
Geospatial Tools in Action: EPA Region 6 GIS Screening Tool for Environmental Assessment and the Texas Ecological Assessment Protocol Sharon L. Osowski, Ph.D. Ecologist EPA Region 6
R6 Office of Planning & Coordination NEPA Compliance Team GeographicGISSTInformation SystemScreening Tool A GIS-Driven Environmental Assessment & Data Management Tool for Environmental Streamlining
R6 Office of Planning & Coordination WHAT IS IT? Uses GIS coverages & databases Scoring structure imposed on data Environmental assessment tool
R6 Office of Planning & Coordination GISST & NEPA The Ultimate Objectives are Strengthen Env. Assessment Process Protection of Human and Ecological Resources
R6 Office of Planning & Coordination HOW IS IT DIFFERENT FROM OTHER TOOLS? Scoring Structure Prioritization tool Comparative “Cumulative” & single media More than just mapping
R6 Office of Planning & Coordination HOW DOES IT WORK? Uses a watershed (or geographic unit) approach to evaluate “risks” Uses “criteria” to evaluate impacts (1-5 scale) Over 90 different criteria (peer reviewed)
R6 Office of Planning & Coordination Criteria Water Quality Ecological Socioeconomic Air Quality Toxicity Pollution Prevention Landscape
Segment 3: Managed Lands Reservoirs Indian Reservations State Parks National Parks & Preserves National Forests
Segment 3: EJ Areas 1.67-2x state average Lower % of economically stressed Higher % of economically stressed
R6 Office of Planning & Coordination EXAMPLE CRITERION Wildlife Habitat % Acres affected Score < 10 % 1 10% < % acres affected < 20% 2 20% < % acres affected < 30% 3 30% < % acres affected < 40% 4 > 40% 5
Results of GISST for the Wildlife Habitat Criterion Criterion scores are calculated for each 1km square GISST can be used to minimize impacts to a single resources, such as wildlife resources.
R6 Office of Planning & Coordination Why ask why? P r o a c t i v e Identification of “red flags” Open process, documentation
TERS Texas Environmental Resource Stewards
TERS Texas Environmental Resource Stewards ************************************************************ Texas Ecological Assessment Protocol (TEAP) Purpose: To identify ecologically important resources across the State in order to support greater collaborative approaches to strategic, ecosystem management.
TERS Texas Ecological Assessment Protocol (TEAP) Good Science- • Selected an ecological model. • Based approach on ecoregions • Conducted analysis for all ecoregions in Texas • Utilized best available Statewide information. • Internal peer review
TERS Texas Ecological Assessment Protocol (TEAP) Three Key Model Aspects • DIVERSITY: habitats & landscapes • RARITY: threatened & endangered species • SUSTAINABILITY: human impacts. • Stressors – environmental quality. • Fragmentation – landscape disruptions.
Texas Ecological Assessment Protocol (TEAP): Diversity • Measures: • Appropriateness of land cover • Contiguous size of undeveloped land • Shannon land cover diversity index • Ecologically significant stream segments Emphasis on land cover & sensitive rivers indices.
Texas Ecological Assessment Protocol (TEAP):Rarity • Measures: • Vegetation rarity • Natural Heritage rank • Taxonomic richness • Rare species richness Emphasis on State & Global Species plus Rare vegetation.
Texas Ecological Assessment Protocol (TEAP):Sustainability • Anthropogenic activities & impacts: • Fragmentation • Stressors • Shows effects of major urban centers. • Measures: • Contiguous land cover type • Regularity of ecosystem boundary • Appropriateness of land cover • Waterway obstruction • Road density • Measures: • Airport noise • NPL sites • Water quality • Air quality • RCRA sites • Urban/Ag
Sustainability layer: resistance to & resilience from human disturbance 11 inputs Diversity layer: landscape connectivity4 inputs Rarity layer: rare species & land cover type4 inputs Composite: identifies important ecological resources in each ecoregion across Texas
Texas Ecological Assessment Protocol (TEAP): Composite Statewide Opportunities for protection in each ecoregion
Composite w/public lands overlay Composite w/6 digit HUC overlay Composite w/Transportation overlay Texas Ecological Assessment Protocol (TEAP): Examples of TEAP use
Percent of Pixels Inside TNC Portfolio I-69 Corridor(excluding Crosstimbers and Southern Tallgrass Prairie and Tamaulipan Thornscrub)
TERS Texas Ecological Assessment Protocol (TEAP) Potential Benefits/Uses Benefits of Landscape Analysis for Planning Large Scale Projects • Identifies locations of environmental constraints. • Identifies potential areas of concern. • Identifies candidate areas for large-scale ecosystem mitigation.
Texas Interstate Highway 69 & Trans Texas Corridor
TO SIU Study Area National Corridor Stage I (Hypothetical): Tier I EIS Tools: EPA R6 GISST, TERS TEAP
TO Preliminary Alignment Alternatives SIU Study Area Stage II (Hypothetical): Tier I & II EIS Tools: GISST, TEAP, QUANTM
Segment 3: Wetland Areas Riparian Reservoirs Wetlands
Results of GISST for the Wetlands Criterion Highway alignments should try to avoid resources by following the lightest color squares (representing a GISST score of “1”) Criterion scores are calculated for each 1km square GISST can be used to minimize impacts to a single resource, such as wetlands
Results of GISST for 20 criteria The GISST score for multiple resources are calculated for each 1km square Areas in red should be avoided GISST can be used to determine the potential cumulative impacts of multiple issues of concern
TO Preliminary Alignment Alternatives Reasonable Alignment Alternatives Stage II (Hypothetical): Tier II EIS Tools: GISST, QUANTM
TERS Texas Ecological Assessment Protocol (TEAP) Strategic Ecosystem Management QUANTM/GISST I-69 Corridor Analysis
TO Reasonable Alignment Alternatives Preferred Alignment Alternative Stage III (Hypothetical): Tier II EIS Tools: GISST, QUANTM, TEAP
R6 Office of Planning & Coordination CONTACTS Dr. Sharon L. Osowski (665.7506) Ecologist Interim Transportation Coordinator David Parrish (665.8352) GIS Dr. Gerald Carney (665.6523) Toxicologist Rhonda Smith (665.8006) Acting Chief GISST Info: www.epa.gov/earth1r6/6en/xp/enxp2a3.htm