Download
1 / 1
10 likes | 152 Vues
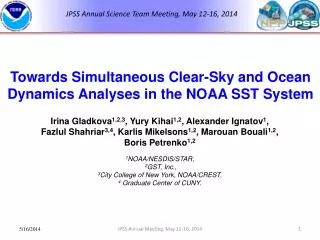
Quantifying the effect of ambient cloud on clear-sky ocean brightness temperatures and SSTs Korak Saha 1,2 , Alexander Ignatov 1 , and XingMing Liang 1,2 1 NOAA/NESDIS/STAR; 2 Colorado State University, CIRA. Center Clear-sky Pixel. 100 Km. Clear sky ocean pixel Cloudy ocean pixel.

E N D
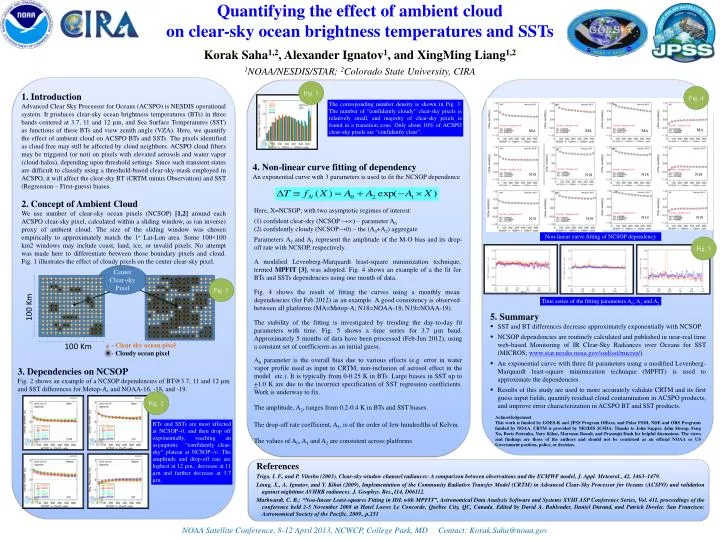
Quantifying the effect of ambient cloud on clear-sky ocean brightness temperatures and SSTs Korak Saha1,2, Alexander Ignatov1, and XingMing Liang1,2 1NOAA/NESDIS/STAR; 2Colorado State University, CIRA Center Clear-sky Pixel 100 Km • Clear sky ocean pixel • Cloudy ocean pixel 100 Km Fig. 3 Fig. 4 1. Introduction Advanced Clear Sky Processor for Oceans (ACSPO) is NESDIS operational system. It produces clear-sky ocean brightness temperatures (BTs) in three bands centered at 3.7, 11 and 12 µm, and Sea Surface Temperatures (SST) as functions of these BTs and view zenith angle (VZA). Here, we quantify the effect of ambient cloud on ACSPO BTs and SSTs. The pixels identified as cloud free may still be affected by cloud neighbors. ACSPO cloud filters may be triggered (or not) on pixels with elevated aerosols and water vapor (cloud-halos), depending upon threshold settings. Since such transient states are difficult to classify using a threshold-based clear-sky-mask employed in ACSPO, it will affect the clear-sky BT (CRTM minus Observation) and SST (Regression – First-guess) biases. 2. Concept of Ambient Cloud We use number of clear-sky ocean pixels (NCSOP) [1,2] around each ACSPO clear-sky pixel, calculated within a sliding window, as (an inverse) proxy of ambient cloud. The size of the sliding window was chosen empirically to approximately match the 1o Lat-Lon area. Some 100×100 km2 windows may include coast, land, ice, or invalid pixels. No attempt was made here to differentiate between those boundary pixels and cloud. Fig. 1 illustrates the effect of cloudy pixels on the center clear-sky pixel. The corresponding number density is shown in Fig. 3. The number of “confidently cloudy” clear-sky pixels is relatively small, and majority of clear-sky pixels is found in a transition zone. Only about 10% of ACSPO clear-sky pixels are “confidently clear”. MA MA MA MA 4. Non-linear curve fitting of dependency An exponential curve with 3 parameters is used to fit the NCSOP dependence N18 N18 N18 N18 Here, X=NCSOP; with two asymptotic regimes of interest: (1) confident clear-sky (NCSOP →∞) – parameter A0 (2) confidently cloudy (NCSOP→0) – the (A0+A2) aggregate Parameters A2 and A1 represent the amplitude of the M-O bias and its drop-off rate with NCSOP, respectively. N19 N19 N19 N19 Non-linear curve fitting of NCSOP dependency Fig. 5 A modified Levenberg-Marquardt least-square minimization technique, termed MPFIT [3], was adopted. Fig. 4 shows an example of a the fit for BTs and SSTs dependencies using one month of data. Fig. 1 Fig. 4 shows the result of fitting the curves using a monthly mean dependencies (for Feb 2012) as an example. A good consistency is observed between all platforms (MA=Metop-A; N18=NOAA-18; N19=NOAA-19). Time series of the fitting parameters A0, A1 and A2 • 5. Summary • SST and BT differences decrease approximately exponentially with NCSOP. • NCSOP dependencies are routinely calculated and published in near-real time web-based Monitoring of IR Clear-Sky Radiances over Oceans for SST (MICROS; www.star.nesdis.noaa.gov/sod/sst/micros/). • An exponential curve with three fit parameters using a modified Levenberg-Marquardt least-square minimization technique (MPFIT) is used to approximate the dependencies. • Results of this study are used to more accurately validate CRTM and its first guess input fields, quantify residual cloud contamination in ACSPO products, and improve error characterization in ACSPO BT and SST products. The stability of the fitting is investigated by trending the day-to-day fit parameters with time. Fig. 5 shows a time series for 3.7 µm band. Approximately 5 months of data have been processed (Feb-Jun 2012), using a constant set of coefficients as an initial guess. A0 parameter is the overall bias due to various effects (e.g. error in water vapor profile used as input to CRTM, non-inclusion of aerosol effect in the model etc.). It is typically from 0-0.25 K in BTs. Large biases in SST up to +1.0 K are due to the incorrect specification of SST regression coefficients. Work is underway to fix. 3. Dependencies on NCSOP Fig. 2 shows an example of a NCSOP dependencies of BT@3.7, 11 and 12 µm and SST differences for Metop-A, and NOAA-16, -18, and -19. Fig. 2 The amplitude, A2, ranges from 0.2-0.4 K in BTs and SST biases. Acknowledgement This work is funded by GOES-R and JPSS Program Offices, and Polar PSDI, NDE and ORS Programs funded by NOAA. CRTM is provided by NESDIS JCSDA. Thanks to John Sapper, John Stroup, Feng Xu, Boris Petrenko, Yury Kihai, Marouan Bouali, and Prasanjit Dash for helpful discussions. The views and findings are those of the authors and should not be construed as an official NOAA or US Government position, policy, or decision. BTs and SSTs are most affected at NCSOP~0, and then drop off exponentially, reaching an asymptotic “confidently clear-sky” plateau at NCSOP~∞. The amplitude and drop-off rate are highest at 12 µm, decrease at 11 µm and further decrease at 3.7 µm. The drop-off rate coefficient, A1, is of the order of few hundredths of Kelvin. The values of A0, A1 and A2 are consistent across platforms. References Trigo, I. F., and P. Viterbo (2003), Clear-sky window channel radiances: A comparison between observations and the ECMWF model, J. Appl. Meteorol., 42, 1463–1479. Liang, X., A. Ignatov, and Y. Kihai (2009), Implementation of the Community Radiative Transfer Model (CRTM) in Advanced Clear-Sky Processor for Oceans (ACSPO) and validation against nighttime AVHRR radiances. J. Geophys. Res.,114, D06112. Markwardt, C. B.; “Non-linear Least-squares Fitting in IDL with MPFIT”, Astronomical Data Analysis Software and Systems XVIII ASP Conference Series, Vol. 411, proceedings of the conference held 2-5 November 2008 at Hotel Loews Le Concorde, Québec City, QC, Canada. Edited by David A. Bohlender, Daniel Durand, and Patrick Dowler. San Francisco: Astronomical Society of the Pacific, 2009., p.251 NOAA Satellite Conference, 8-12 April 2013, NCWCP, College Park, MD Contact: Korak.Saha@noaa.gov