Download
1 / 19
190 likes | 271 Vues
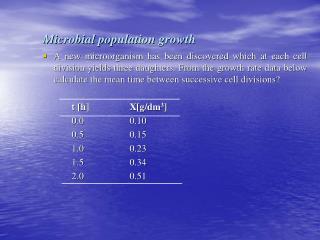
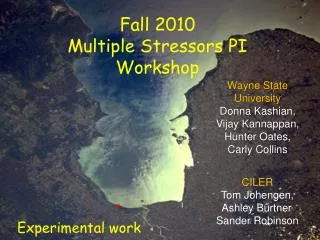
Presentation made at the Annual Conference of the International Association for Great Lakes Research Ann Arbor, MI, May 2005. Evaluating Single and Multiple Stressors in Watershed Risk Assessment. Research sponsored by. Jessica Brooks Hardik Virani Dr. Vladimir Novotny. STAR Program

E N D
Presentation made at the Annual Conference of the International Association for Great Lakes Research Ann Arbor, MI, May 2005 Evaluating Single and Multiple Stressors in Watershed Risk Assessment Research sponsored by Jessica Brooks Hardik Virani Dr. Vladimir Novotny STAR Program Views presented are those of the authors and not of USEPA
Project Overview • Goal: To determine the risk to fish communities based on in-stream stressors including, chemical, habitat, and sediment quality. • Methods • Single Stressors • LC50 Toxic Response Curves • Maximum Species Richness Lines (MSRLs) • Multiple Stressors • Artificial Neural Network
LC50 Toxic Response • LC50: Concentration of stressor lethal to 50% of test organisms • Fish and invertebrate species grouped based on tolerance and/or trophic condition. • Response of group defined by distribution of LC50s • Data easily available from U.S. EPA ECOTOX Database
Calculating Risk using LC50 Ecological risk from stormwater impacts (Novotny and Witte 1997) H(R, C) = f(EMC)g(R|EMC)
Maximum Species Richness • MSR represents the maximum number of species that can be expected to survive in the specified conditions. • Originally developed to calculate Index of Biotic Integrity (IBI). Number of species plotted versus stream order. • MSR can be adjusted to calculate risk from a single stressor by plotting the number of species versus the concentration of the stressor of interest. • Developed from field data provided by OhioEPA
Sample MSRLs MSR boundary defined by 95% regression
Risk from MSRLs Risk defined as: 1 – Probability of Survival.
Dealing with Multiple Stressors • Many current approaches are incapable of dealing with multiple stressors directly. • Most single stressor risk assessments assume stressors are additive. • Artificial neural networks (ANN) are capable of considering multiple inputs and evaluating their relative impact.
Quick Intro to ANN A model of a layered network (Demuth and Beale 1992)
Artificial Neural Networks • Advantages • Generalization • Handle large data sets • Models linear and non-linear relationships • Disadvantage • “Black Box” • Where do you start?
Application of ANN • Supervised learning techniques used to develop prediction of IBI. • Feed-forward backpropagation networks tested • Input included chemical and habitat quality measurements and ICI to represent soil quality. • Target for prediction was IBI. • Data obtained from Ohio EPA database, years 1995-2001
Input • Ohio database includes measurements of 48 water quality parameters, 9 habitat parameters, and 3 types of land cover. • Initially parameters chosen based on availability and expected influence. • Habitat represented by composite value of Quantitative Habitat Evaluation Index (QHEI)
Initial Results using QHEI Calibration Simulation Problem: Garbage In = Garbage Out
Evaluation of Parameters In a study by Virani (2005), unsupervised neural network evaluation used to identify most influential parameters. Habitat parameters identified as critical components. Network simulations re-run with parameters including individual habitat measurements.
Results using Habitat Data Prediction Simulation
Conclusions • Preliminary results suggest that reasonable predictions of biotic integrity are possible using supervised learning. • Habitat parameters are key elements of input sets. • Other influences may be included to improve results.
Thanks! • Dr. Vladimir Novotny • Dr. Elias Manolakos • Dr. Alena Bartošová • Hardik Virani • Edward Rankin • US Environmental Protection Agency (Bernice Smith, Project officer)


![Risk MAP and Discovery FEMA Region [#], [WATERSHED NAME] Watershed](https://cdn1.slideserve.com/2868558/risk-map-and-discovery-fema-region-watershed-name-watershed-dt.jpg)