Download
1 / 19
190 likes | 315 Vues
Seizure prediction by non-linear time series analysis of brain electrical activity. Ilana Podlipsky. Epilepsy. Epilepsy

E N D
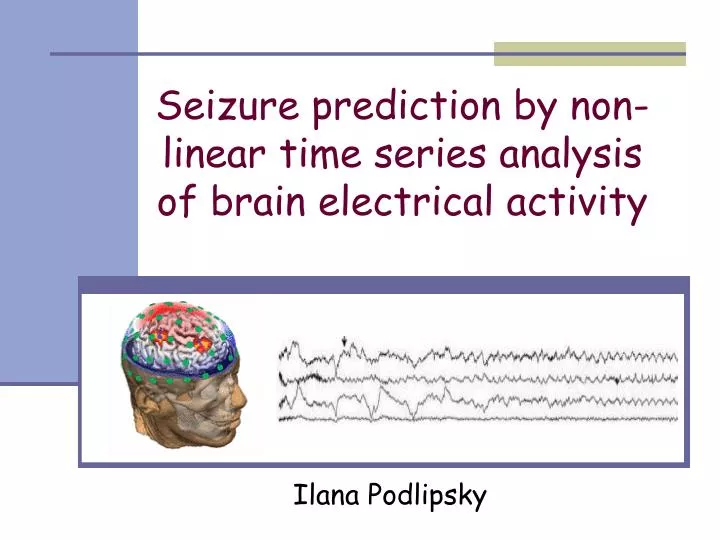
Seizure prediction by non-linear time series analysis of brain electrical activity Ilana Podlipsky
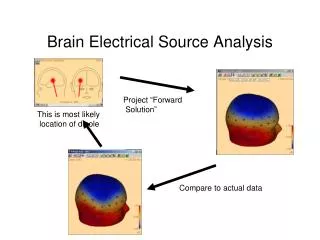
Epilepsy • Epilepsy • Synchronous firing of neurons which create high amplitude electrical discharges; this ‘storm’ inhibits other neural signals from getting through and disables function areas of the brain • Statistics • Everyone's brain has the ability to produce a seizure under the right conditions • 1 in 20 will have an epileptic seizure at some time in their life • Treatment • Once diagnosed with epilepsy, people are generally given anti-epileptic medication. With the appropriate treatment, up to 70% of people could be seizure free. • Characteristics / symptoms • Seizures (40 different types) • ‘Aura’, a sensory hallucination, often precludes a seizure • EEG • Recording of neural activity of targeted neurons / neural regions in brain • Outputs brainwaves with associated rhythms and frequencies
Theproblem • ~30% of epileptics left untreated and victim of violent seizures • Injuries resulting from epilepsy is most often caused by convulsive seizures • If a ‘lead-time’ could be provided by a seizure detection system, physical injury would be greatly reduced and quality of life increased
Distinctive Features of Epilepsy • The epileptogenic process is characterized by abnormal synchronous burst discharges in neuronal cell assemblies recordable during and in between seizures (Matsumoto & Ajmone‐Marsan 1964a, Matsumoto & Ajmone Marsan 1964b; Babb et al. 1987). • The transition to a seizure is caused by an increasing spatial and temporal non-linear summation of the activity of discharging neurons (Calvin 1971; Calvin et al. 1973). • Due to the typically unpredictable occurrence of seizures it remains difficult to investigate the rules governing the initiation of seizure activity in humans.
Brain as a Dynamic System • A dynamical system consists of • State • Dynamics • State – the information necessary at any time instant to describe the future evolution of a system • Dynamics – defines how the state evolves over time
Attractors and Dimensions • Attractor • Set of states towards which the system evolves – Characterizes the long term behavior of the system • Dimension of a system • Describes the amount of information required to specify a point on the attractor - the long term behavior of a system • More complex behavior – more information is required to describe this behavior – higher dimension of the system
Brain as a Dynamic System • The application of the theory of non-linear dynamics offers information about the dynamics of the neuronal networks. • Several authors have shown that EEG/ECoG signals exhibit chaotic behavior (Basar,1990; Frank et al,1990; Pijn et al,1991). • The correlation dimension D2(Grassberger and Procaccia1983), provides good information about EEG complexity and chaotic behavior. (Mayer-Kress and Layne (1987) )
Dynamics of Epileptic EEG • The spatio-temporal dynamics of the epileptogenic focus is characterized by temporary transitions from high-to low-dimensional system states (dimension reductions)(Lehnertz & Elger 1995,1997). • These dimension reductions allow the lateralization and possibly localization of the epileptogenic focus (Lehnertz & Elger 1995,1997).
Seizure prediction by non-linear time series analysis of brain electrical activityChristian E. Elger, Klaus Lehnertz (1998) • Do prolonged and pronounced transitions from high - to low - dimensional system states characterize a pre-seizure phase? • The identification of this phase would enable new diagnostic and therapeutic possibilities in the field of epileptology.
Methods • Electrocorticograms (ECoG) and stereoelectroencephalograms (SEEG) of 16 patients • 68 EEG epochs were analyzed. • Fifty‐two data sets of state 1; mean duration: 19.5 ± 6.9 min; range: 6–40 min; minimum distance to any seizure: 24 h. • 16 data sets of state 2; mean duration before the electrographic seizure onset: 15.1 ± 5.8 min; range: 10–30 min; seizure onset was defined as earliest signs of ictal ECoG/SEEG patterns). Seizure prediction by non‐linear time series analysis of brain electrical activity Christian E. Elger, Klaus Lehnertz (1998)
Methods • A moving window dimension analysis was applied: • Data sets were segmented into half-overlapping digitally low-pass filtered consecutive epochs of 30 s duration. • Calculation of the modified correlation integral - the mean probability that the states at two different times are close. • Estimate of the correlation dimension D2for each epoch. Seizure prediction by non‐linear time series analysis of brain electrical activity Christian E. Elger, Klaus Lehnertz (1998)
Calculation of correlation dimension • Digital low-pass filtering (cut-off frequency 40 Hz) • Construction of m-dimensional vectors Xm(i) (i = 1, N; m = 1,. . . , 30) from the initial ECoG samples v(i) (i = 1, N) of a given electrode using the method of delays (Takens, 1981): Seizure prediction by non‐linear time series analysis of brain electrical activity Christian E. Elger, Klaus Lehnertz (1998)
Correlation Integral • For a stepwise decreasing radius r of a hypersphere centered at each vector Xm(i) for increasing m the correlation integral Cm(r) was calculated as(Grassberger and Procaccia, 1983): • Counts the number of pairs of points with distance less then r. • For small r: Cm(r) ≈ rD2 • D2 = slope of (in a linear region)
Calculation of Correlation Dimension • The correlation dimension D2is obtained by: D2=slope of for decreasing r in a linear region • Alternatively: • If no linear region is found D2 = 10
Results • For each selected electrode of the ECoG sets, a time profile of the estimated D2, values was constructed. • The seizure (S) exhibits lowest dimension values. Seizure prediction by non‐linear time series analysis of brain electrical activity Christian E. Elger, Klaus Lehnertz (1998)
Results • For both states maximum dimension reductions were always found inside the epileptogenic focus regardless of spike activity. • During state 2, maximum dimension reductions were always observed in time windows immediately preceding seizures. • In state 1: • Dimension reductions with a mean of 1.0; range 0.5-2.5. • Mean duration of 5.25min; range 1.00–10.75 min. • In state 2: • Dimension reduction mean 2.0; range: 1.0–3.5. • Mean duration 11.50 min; range: 4.25–25.00 min. • Highly significant differences between maximum state 1 and pre-seizure state dimension reductions (Dr: Z = – 3.41, P = 0.0006;Tr: Z = – 3.52, P = 0.0004). Seizure prediction by non‐linear time series analysis of brain electrical activity Christian E. Elger, Klaus Lehnertz (1998)
Discussion • A reduced dimensionality of brain activity, as soon as it is of sufficient size and duration, precisely defines states which proceed to a seizure. • I was demonstrated that the features of the pre-seizure state differ clearly from the one found during seizure. • Pronounced dimension reductions of pre-seizure electrical brain activity are restricted to the area of the epileptogenic focus, they can reflect increasing degree of synchronicity of pathologically discharging neurons. Seizure prediction by non‐linear time series analysis of brain electrical activity Christian E. Elger, Klaus Lehnertz (1998)
Discussion • Correlation Dimension measure as presented here is subjective. • Highly sensitive to noise. • Subject specific.