Download
1 / 14
150 likes | 905 Vues
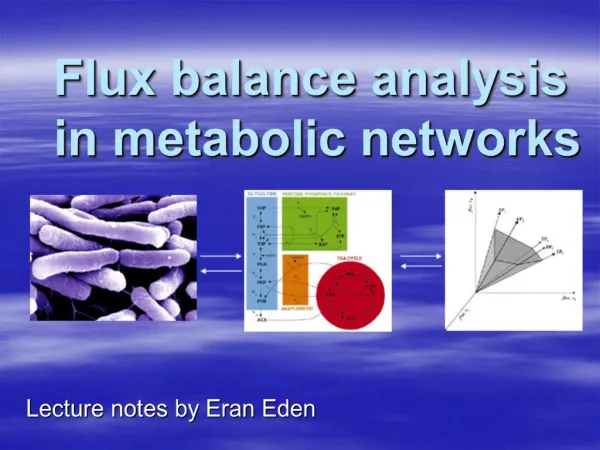
Metabolic Flux Analysis by MATLAB. Xueyang Feng Dept. of Energy, Environmental & Chemical Engineering Washington University in St. Louis. Metabolic Flux Analysis. Flux Balance Analysis (FBA) in silico simulation Linear programming (LP) Genome-scale . 13 C-assisted Metabolic Flux Analysis

E N D
Metabolic Flux Analysis by MATLAB XueyangFeng Dept. of Energy, Environmental & Chemical Engineering Washington University in St. Louis
Metabolic Flux Analysis Flux Balance Analysis (FBA) • in silico simulation • Linear programming (LP) • Genome-scale 13C-assisted Metabolic Flux Analysis • in vivo search • Nonlinear programming (NLP) • Simplified model maximize ∑ci ∙vi s.t. S∙v = 0 lb < v < ub minimize (MDVexp-MDVsim)2 s.t. S∙v = 0 IDV = f(v, IMM, IDV) MDV = M∙IDV lb < v < ub Metabolic Steady state Metabolic & isotopic Steady state
Flux Balance Analysis (FBA) 16 fluxes, 7 intracellular metabolites Glucose v1 v2 G6P R5P v16 v3 v4 Pyr v15 v5 v11 v14 v6 AcCoA Acetate The transport fluxes were measured: v13 v7 OAA ICIT v10 v8 The building block fluxes can be assumed from biomass composition: SUC AKG v9 v12 17 variables 15 equations Freedom = 2 Transport flux Intracellular flux Building block flux
Variables (fluxes) Linear constraints S ∙ v = 0
Flux Balance Analysis (FBA) maximize μ s.t. S∙v = 0 0 < v < 20 mmol/g DCW/h
Optimization Toolbox for Flux Analysis Two ways to launch optimization toolbox in MATLAB: • “Start” “Toolboxes” “Optimization” “Optimization Tool (optimtool)” • In the command window, enter “optimtool” Use “linprog” for FBA Change to “Medium scale-simplex” Options to stop the optimization Put the objective vector S∙v=0 lb and ub
Click “Start” to run the optimization Optimized objective function value Optimized flux results Experimental observed: μ=0.82 h-1 FBA simulated : μ=1.54 h-1
13C-assisted Metabolic Flux Analysis (13C-MFA) A simple case: Glucose CO2 v1 v2 v16 G6P R5P ratio: v3/v4 v3 v4 Pyr 16 fluxes, 7 intracellular metabolites v15 v5 v11 v14 v6 AcCoA Acetate v13 v7 OAA ICIT v10 v8 SUC AKG v9 v12 The transport fluxes were measured: Transport flux Intracellular flux The building block fluxes are not necessary to be assumed Building block flux
Variables (fluxes) Linear constraints S ∙ v = 0
13C-assisted Metabolic Flux Analysis (13C-MFA) minimize (MDVexp-MDVsim)2 s.t. IDV = f(v, IMM, IDV) MDV = M∙IDV S∙v = 0 0< v < 20 achieved in .m file
MATLAB Code for 13C-MFA Input the variables Isotopomer transitions Identify labeling of CO2 Reach the Isotopic steady state in TCA cycle Input the experimental observed MDV
Optimization Toolbox for Flux Analysis Using “fmincon” solver in Optimization Toolbox for 13C-MFA Use “fmincon” for 13C-MFA Change to “Interior point” Initial guess S∙v=0 Put the objective function S∙v=0 lb and ub
Summary • The goals of FBA and 13C-MFA are different. Choose wisely ! • More assumptions in FBA than 13C-MFA • Scale of FBA is commonly much larger than 13C-MFA • Both FBA and 13C-MFA are at metabolic steady state Question:how to calculate dynamic flux distribution?