Download
1 / 16
160 likes | 263 Vues
Monitoring of Restored Vegetation in the Wolf Lake Wetlands. Rachel Shmagranoff. Wolf Lake Background. 804 ha (450 acres) Once part of Lake Michigan, but then 19 th century industrialization and roads disconnected it Maximum depth of 5.5 m (18 feet) Habitat for many species including

E N D
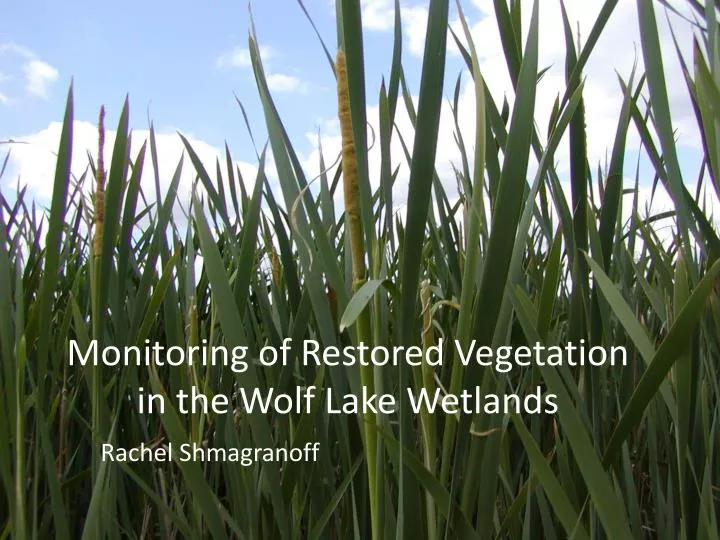
Monitoring of Restored Vegetation in the Wolf Lake Wetlands Rachel Shmagranoff
Wolf Lake Background • 804 ha (450 acres) • Once part of Lake Michigan, but then 19thcentury industrialization and roads disconnected it • Maximum depth of 5.5 m (18 feet) • Habitat for many species including • Franklin ground squirrel (Spermophilustridecemlineatus) • Lake sturgeon (Acipenserfulvescens) • Black-crowned night heron (Nycticoraxnycticorax)
Restoration • Controls exotic species, creates new environments and diversity • Dredging in pool #9 to be caught by filtering wetland strips so it doesn’t contaminate pool #8 Pool #9 Pool #8
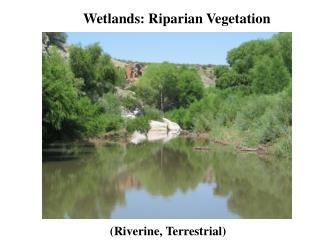
Field Site • The area surveyed consisted of: • Main shoreline stretching 370 linear meters • 13 islands
Timeline Plot set up and analysis of main shoreline Invertebrate sampling Water sampling and algae analysis Island plot set up and surveying Shoreline and island clean up Bird Nest survey May 15-May 30 June 6-June 15 June 18-July 6 July 2 –July 30 July 31-August 10 June 27
Survey Technique for Main shore • Plot setup: • Marker pole placed every 20 meters • Made 36 shoreline plots • 1x1meter plot set at every pole • Point-contact method conducted • Species identified and tallied
Surveying the Islands • Shore line • 1x1meter plots every 20 meters • Water line • 1x1meter plots every 20 meters • Upland • 1x1meter plots every 10 meters
Invasive Vegetation Problem • Phragmites frequency • Total plots/ total touches: 590/92 = 6.41 • Purple Loosestrife frequency • 648/103= 6.29 • Cattail frequency • 254/25= 10.16
Area Clean Up garbage wire Metal spikes Ropecord Plastic mesh Restoration remnants
Bird Nest Survey • Birds Nests Found • 10 Canadian geese • 8 Red winged black birds • 4 sandpipers • 3 mallards • 3 Killdeer • 1 Mute Swan Sandpiper nest Mallard nest Red winged black bird nest Red winged black bird nest
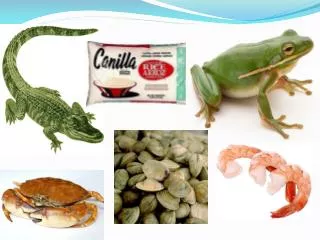
Invertebrates • Top species caught • 183 ephemeroptera (mayfly) • 175 amphipoda (shrimp) • 103 gastropoda (snails) • 39 hirudinea (leech) • 10 other species tallying 56
Water and Algae Sampling Algae Water Dissolved oxygen Manganous Sulfate and Alkaline Iodide-Azidereagents Titration usingPhenylarsine Oxide Conductivity pH • 25 buckets of water poured through filter • Algae trapped in container at bottom • Algae identification and volume to be assessed at a later date