Download
1 / 16
160 likes | 268 Vues
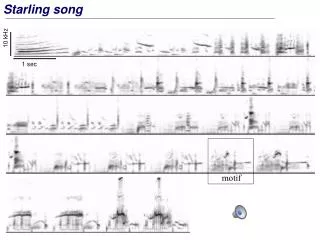
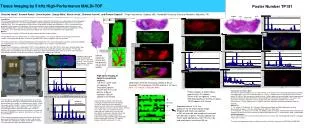
Mid to High Frequency (1-20 kHz) Acoustics at the Central Area, August 9-20. Applied Physics Laboratory University of Washington Peter H. Dahl, Jee Woong Choi.

E N D
Mid to High Frequency (1-20 kHz) Acoustics at the Central Area, August 9-20 Applied Physics Laboratory University of Washington Peter H. Dahl, Jee Woong Choi Science measurement goal: measure contemporaneously MF acoustics and influencing environmental scales for ocean acoustic modeling and interpretation • Acoustic Measurements: • Bottom Loss (20log|R|) 1-20 kHz, Grazing Angles 10-80o • 3D Spatial Coherence (single and multi-paths) • Sea Surface (energy) Loss (single and multi-paths) • Sea Surface backscattering (11-60 kHz) • Environmental Measurements: • Directional Wave • MORAY 1+ acoustic receiving array aux data: air & sea temp and sea surface elevation
APL LEAR Deployments SMALLER SCALE VIEW 0.5 0 WHOI environmental mooring -0.5 U-Miami wave buoy -1 MORAY 1+ VLA/HLA Receiving Array -1.5 Y (km) -2 500 m APL-UW wave buoy -2.5 Track of the R/V Endeavor for internal wave & acoustic propagation study -3 Ship-deployed source location (via precise positioning of R/V Knorr) -3.5 -4 -0.5 0 0.5 1 1.5 2 2.5 X (km)
Shark 500 m 50 m 100 m 200 m 300 m 500 m 300o 1000 m 14 U Miami 1000 m 10 6 2 M1+ 15 11 7 3 1 5 9 13 A2 A1 1000 m 500 m 4 8 12 Basic Layout for MF measurements about the MORAY 1+ VLA/HLA system 16 B1 KEM 1000 B2
0m 50m 100m 200m 300m 25m 40m 80m 50m A B C D E F G H X Y BOTTOM REFLECTION X Y : size of 1st Fresnel zone (m)
SD: 40 m RD: 25 m 0 0.4 10 20 30 40 50 MF output (8-16 kHz) 60 70 -0.4 0 20 40 60 80 10 120 140 160 180 200 100 150 200 250 TIME (ms) RANGE (m) SD: 40 m RD: 50 m 0.4 0 10 20 30 40 50 MF output (8-16 kHz) 60 70 -0.4 0 20 40 60 80 10 120 140 160 180 200 100 150 200 250 TIME (ms) RANGE (m) C5 position (200 m range)
SD: 40 m RD: 25 m 0.5 0 10 20 30 40 50 60 70 -0.5 80 0 50 100 150 200 250 300 180 200 220 240 260 280 300 320 TIME (ms) RANGE (m) SD: 40 m RD: 50 m 0 0.5 10 20 30 40 50 60 70 80 -0.5 0 50 100 150 200 250 300 180 200 220 240 260 280 300 320 RANGE (m) TIME (ms) C13 position (300 m range)
20 20 1 kHz 10 kHz 14 15 15 10 10 10 BOTTOM LOSS 5 5 6 0 0 2 start -5 -5 M1+ 15 11 7 3 1 5 9 13 10 20 40 60 10 10 10 10 10 30 30 30 30 30 30 50 50 50 50 50 50 70 70 70 70 70 70 20 40 60 4 20 20 3 kHz 14 kHz 8 15 15 12 10 10 BOTTOM LOSS 5 5 16 0 0 -5 -5 20 40 60 20 40 60 20 20 6 kHz 20 kHz 15 15 10 10 BOTTOM LOSS 5 5 300o 0 0 -5 -5 20 40 60 20 40 60 GRAZING ANGLE (deg.) GRAZING ANGLE (deg.) C1 C13 direction
14 20 20 1 kHz 10 kHz 15 15 10 10 10 BOTTOM LOSS 6 5 5 2 start 0 0 M1+ 15 11 7 3 1 5 9 13 10 10 10 10 10 30 30 30 30 30 30 50 50 50 50 50 50 70 70 70 70 70 70 -5 -5 10 4 20 40 60 20 40 60 8 20 20 3 kHz 14 kHz 15 15 12 10 10 BOTTOM LOSS 16 5 5 0 0 -5 -5 20 40 60 20 40 60 20 20 6 kHz 20 kHz 15 15 10 10 BOTTOM LOSS 300o 5 5 0 0 -5 -5 20 40 60 20 40 60 GRAZING ANGLE (deg.) GRAZING ANGLE (deg.) C1 C13 direction C2 C14 direction
Knorr move out at 0.1 m/s Continuous Angle Study Range: 50-300 m C2 C14 C1 C13 50 m 250 m Time (ms) C3 C15 C4 C16
20 2 kHz 15 10 BOTTOM LOSS (dB) 5 0 -5 10 20 30 40 50 60 70 GRAZING ANGLE (deg.) M1-M13 direction M2-M14 direction 20 4 kHz 15 10 BOTTOM LOSS (dB) 5 0 -5 10 20 30 40 50 60 70 GRAZING ANGLE (deg.) Geoacoustic model for the site PE-derived bottom loss (Seattle 06 meeting) Water ~1485 m/s 1600 m/s 80 m 80.2 m 1720 m/s 81 m 1560 m/s 84.9 m 1750 m/s 95 m Half space 1900 m/s
Wave Conditions 10 August LF (swell) from the South HF (wind waves) from the East
Shark 500 m 50 m 100 m 200 m 300 m 500 m 300o 1000 m 14 U Miami 1000 m 10 6 2 M1+ 15 11 7 3 1 5 9 13 A2 A1 1000 m 500 m 4 8 12 16 B1 DIFFERENT PROPAGATIONDIRECTIONS THROUGH THE DIRECTIONAL WAVE FIELD KEM 1000 B2
Knock Down of Horizontal Spatial Coherence at High Sea State Horizontal Coherence Vertical Coherence 15 AUG 12m/s Coherence Magnitude 9 AUG 4m/s kD/2p kD/2p
Energy loss due to near surface bubbles for single surface interaction at grazing angle 15o (Preliminary results—heavy averaging) Very interesting applied and basic implications…. > 10 kHz, ~3 dB Loss (dB) < 10 kHz, ~0 dB Frequency (kHz)
The road ahead Key data needs: ASIS buoy and wind speed (to replace Knorr IMET) [Graber & Williams] bottom strategraphy, layering and roughness + cores in the central area [Tang, Goff, Turget, Wang] Mooring CTD in the central area (from “forest mooring”) [Duda et al.] Later on, surface modeling (to extend observations) [Plant’s model] First (three) lines of inquiry: -Towards one geoacoustic model for the Central Site consistent over LF-MF experimental groups -3D spatial coherence: role of sea surface, (use of small slope approx.) kH >> 1 roughness -Spatial coherence of bottom forward reflection and relation to kH<< 1 roughness