Download
1 / 8
80 likes | 217 Vues
Retrieval of Latent Heat in a Rapidly Intensifying Hurricane Stephen Guimond, Code 613.1, NASA GSFC and ORAU/NPP .

E N D
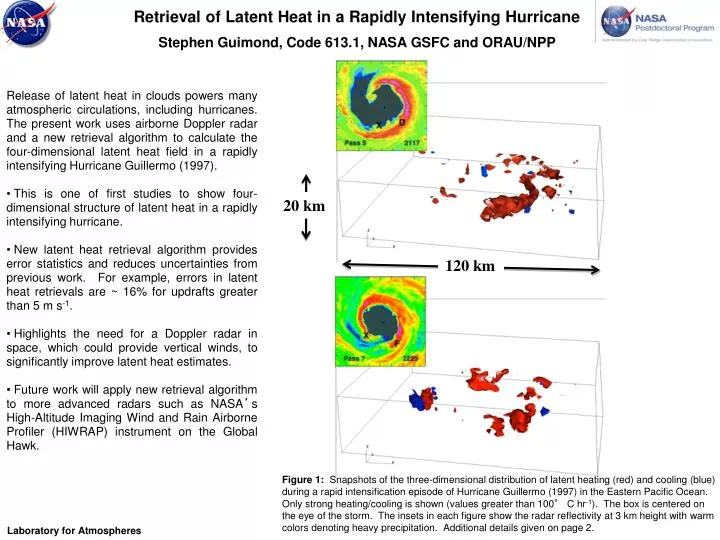
Retrieval of Latent Heat in a Rapidly Intensifying HurricaneStephen Guimond, Code 613.1, NASA GSFC and ORAU/NPP • Release of latent heat in clouds powers many atmospheric circulations, including hurricanes. The present work uses airborne Doppler radar and a new retrieval algorithm to calculate the four-dimensional latent heat field in a rapidly intensifying Hurricane Guillermo (1997). • This is one of first studies to show four-dimensional structure of latent heat in a rapidly intensifying hurricane. • New latent heat retrieval algorithm provides error statistics and reduces uncertainties from previous work. For example, errors in latent heat retrievals are ~ 16% for updrafts greater than 5 m s-1. • Highlights the need for a Doppler radar in space, which could provide vertical winds, to significantly improve latent heat estimates. • Future work will apply new retrieval algorithm to more advanced radars such as NASA’s High-Altitude Imaging Wind and Rain Airborne Profiler (HIWRAP) instrument on the Global Hawk. 20 km 120 km Figure 1: Snapshots of the three-dimensional distribution of latent heating (red) and cooling (blue) during a rapid intensification episode of Hurricane Guillermo (1997) in the Eastern Pacific Ocean. Only strong heating/cooling is shown (values greater than 100° C hr-1). The box is centered on the eye of the storm. The insets in each figure show the radar reflectivity at 3 km height with warm colors denoting heavy precipitation. Additional details given on page 2. Laboratory for Atmospheres
Name: Stephen Guimond, NASA/GSFC, Code 613.1 and ORAU/NPP E-mail: stephen.guimond@nasa.gov Phone: 301-614-5809 References: Guimond, S.R., M.A. Bourassa and P.D. Reasor, 2011: A latent heat retrieval and its effects on the intensity and structure change of Hurricane Guillermo (1997). Part I: The algorithm and observations. Journal of the Atmospheric Sciences, in press. Godinez, H.C., J.M. Reisner, A.O. Fierro, S.R. Guimond and J. Kao, 2011: Optimally estimating key model parameters of rapidly intensifying Hurricane Guillermo (1997) using the ensemble Kalman filter. Journal of the Atmospheric Sciences, submitted. Guimond, S.R., G.M. Heymsfield, and F.J. Turk, 2010: Multiscale observations of Hurricane Dennis (2005): The effects of hot towers on rapid intensification. Journal of the Atmospheric Sciences, 67, 633-654. Contributors: Mark Bourassa (COAPS/FSU) and Paul Reasor (NOAA/HRD) Data Sources: NOAA WP-3D airborne Doppler radar and particle probe data, NASA high-altitude dropsondes from ER2, numerical model (MM5) output. Technical Description of Figures: Figure 1: Three-dimensional isosurfaces of latent heating (red) and cooling (blue) at a rate of 100 °C/h in Hurricane Guillermo (1997) during a period of rapid intensification in the Eastern Pacific Ocean. The box is storm-centered extending 120 km on a side in the horizontal (at 2 km resolution) and 20 km tall in the vertical (at 1 km resolution). The insets show radar reflectivity at 3 km height from the Lower Fuselage (LF) radar onboard the NOAA P3s with warm colors denoting the eyewall. The aircraft made ten passes through the storm separated by ~ 30 minutes. The pass number and time in UTC on August 2, 1997 are labeled on the insets. Letters on the insets label locations of convective bursts that were tracked as they rotated around the vortex. Scientific significance: Latent heating is one of the most fundamental quantities of the atmosphere, controlling the dynamics of circulations across a spectrum of scales including high-impact events such as hurricanes. Current space instrumentation and retrieval methods contain significant uncertainties with the present work aimed at reducing those uncertainties. The retrieval method and observations shown in this work will serve society by improving forecasts of hurricane impacts and by providing a more complete understanding of atmospheric dynamics. Relevance for future science and relationship to Decadal Survey: Latent heat retrievals are a major goal of both the Tropical Rainfall Measuring Mission (TRMM) and Global Precipitation Mission (GPM) as well as proposed future missions related to clouds and water vapor such as Precision and All-Weather Temperature and Humidity (PATH), Aerosol-Cloud-Ecosystems (ACE), and Active Sensing of CO2 Emissions over Nights, Days, and Seasons (ASCENDS). Laboratory for Atmospheres
A Dual-Frequency Radar Accuracy Improvement Technique R. Meneghini, L. Liao, J.A. Jones, Code 613.1, NASA GSFC; S. Tanelli and S.L. Durden, JPL • For the Global Precipitation Mission (GPM), a dual-frequency weather radar, built by JAXA of Japan, will be flown. Correcting the radar signal for the effects of attenuation is important in determining characteristics of precipitation from spaceborne weather radar data. • The objective of this study is to determine whether this method can be applied to data from the dual-frequency radar. • One method of doing this is to use the surface as a reference target (Surface Reference Technique): the difference between the apparent surface return in rain relative to the return in rain-free areas is proportional to the 2-way path-integrated attenuation (PIA) caused by the precipitation. • Using airborne dual-frequency radar data, the study concludes that the method can be extended to dual-frequencies and with improved accuracy relative to the single-frequency results. Figure 1. Radar returns and path-attenuation estimates from the JPL airborne radar. Top panel: Radar reflectivity factor from Ka-band (35.4 GHz) at near-nadir incidence. Center: Path attenuation estimates from Ku-band (13.6 GHz; blue) and Ka-band (red). Bottom panel: normalized surface cross sections (0) at Ka-band across the swath (± 25o). Figure 2. Different implementations of the Surface Reference Technique for Ku-band (left panels), Ka-band (center panels) and differential (right panels). The smaller scatter among the results in the right-hand panel indicate that estimates of the differential attenuation, the difference between the attenuations at Ka and Ku-bands, are more accurate than the estimates at either frequency. Laboratory for Atmospheres
Name: Robert Meneghini, NASA/GSFC, Code 613.1 E-mail: robert.meneghini-1@nasa.gov Phone: 301-614-5652 References: Meneghini, R., L. Liao, S. Tanelli, and S.L. Durden, 2011: Assessment of the performance of a dual-frequency surface reference technique, IEEE Transactions on Geoscience and Remote Sensing (submitted). Meneghini, R. and J.A. Jones, 2011: Standard deviation of spatially-averaged surface cross section data from the TRMM Precipitation Radar, IEEE Geoscience and Remote Sens. Letters, vol. 8, pp. 293-297. Meneghini, R, J.A. Jones, T. Iguchi, K. Okamoto, and J. Kwiatkowski, 2004: A hybrid surface reference technique and its application to the TRMM Precipitation Radar, J. Atmospheric and Oceanic Technology, vol. 21, pp. 1645-1658. Data Sources: TRMM Precipitation Radar, JPL Airborne Precipitation Radar. Technical Description of Figures: The Surface Reference Technique has been used in the TRMM Precipitation Radar (PR) algorithms and has been shown to be useful for moderate and heavy rain rates. We wish to understand the performance of the method for a dual-frequency radar of the kind to be flown on board the GPM satellite. Figure 1: Radar returns over a 30 min period from the APR 2 (Airborne Precipitation Radar, 2nd generation) JPL radar, taken during the TC4 field campaign in 2007. Top panel: Measured radar reflectivity factor from Ka-band (35.4 GHz) at near-nadir incidence. Center: Near-nadir path attenuation estimates from Ku-band (13.6 GHz, blue) and Ka-band (red) derived from the reduction in the surface return, 0, shown in the lower panel. Bottom panel: Normalized surface cross sections (0 ) at Ka-band across the swath (± 25o). Note that the effects of attenuation are evident in the measured radar reflectivities and 0 by the decrease in signal level. Figure 2.Different implementations of the Surface Reference Technique for Ku-band (left panels), Ka-band (center panels) and differential (right panels). The smaller scatter among the results in the right-hand panel indicate that estimates of the differential attenuation, the difference between the attenuations at Ka and Ku-bands, are more accurate than the estimates at either frequency. This improvement arises from the fact that the surface cross sections (0) at the two frequencies are highly correlated so that differences in 0 observed in rain are more directly related to atmospheric attenuation and less dependent on variations in the surface scattering properties. Scientific significance: Attenuation correction is critical to retrieving characteristics of the precipitation from spaceborne weather radars. The study shows that data from a dual-frequency radar with matched beams can be used to correct attenuation effects more accurately than a single-frequency radar. This promises improved estimates of rainfall rate and liquid water content from a radar of this type. Relevance for future science and relationship to Decadal Survey: Among the proposals for the next generation spaceborne radar has been a dual-frequency Ka-band/ W-band combination. Since the correlation of the surface cross sections at the two frequencies is closely related to the accuracy by which the attenuation can be corrected, studies are needed to assess this correlation of the normalized radar cross section of the surface at Ka- and W-band as a function of surface type, incidence angle and the degree of matching between the fields of view. Laboratory for Atmospheres
Cloud Regime Radiative Forcing from ISCCP Lazaros Oreopoulos, Code 613.2, NASA GSFC Global Climate Models (GCMs), our most advanced computer tools for predicting climate change are quite capable in producing, on average, a budget of solar radiation reflected and thermal radiation emitted to space that is close to observations. “On average” is, however, a key qualifier: the agreement with observations is achieved only when both the observations and model output are averaged over long temporal (months, years) and large spatial (global, hemispherical, zonal) scales. The apparent agreement gives us undeserved confidence in the models because often it is a result of compensating errors. One example where it is critical not to bypass the details, is when we deal with the role of clouds in the planet’s radiation budget. If the effect of clouds appears in a GCM to be good “on average” one may be tempted to conclude that clouds are well-simulated, which may not be true upon closer scrutiny. In a recent paper (Oreopoulos and Rossow 2011) we propose a method that will provide the tools to examine in more depth the verisimilitude of GCM clouds. Specifically, we break down the radiative effect of clouds by cloud regimes (cloud type mixtures). The regime specification is based on International Satellite Cloud Climatology Project (ISCCP) satellite observations and was combined with another data set from the same project, to conditionally average the radiative effect of each regime. The work reveals the relative contribution to the the overall cloud radiative effect of each cloud regime. We claim that the basic features of the radiative behavior seen in the data should be also reproduced by GCMs. CR1 30 20 10 CR3 0 CR5 low RFO high RFO Figure 1: Maps of the relative frequency of occurence (RFO) for three tropical cloud regimes (CR) defined by the joint histograms of cloud top pressure and optical thickness to the left. Figure 2: The percent contribution to the tropical shortwave (SW), longwave (LW) and net (dotted lines) top of the atmopshere (TOA) cloud radiative effect CRE (forcing) of the eight ISCCP tropical cloud regimes. Laboratory for Atmospheres
Name: Lazaros Oreopoulos, NASA/GSFC Code 613.2 E-mail: lazaros.oreopoulos@nasa.gov Phone: 301-614-6128 References: Oreopoulos, L. and. W. B. Rossow, 2011: The Cloud Radiative Effects of ISCCP Weather States. J. Geophys. Res., in press. Preview available at http://www.agu.org/journals/pip/jd/2010JD015472-pip.pdf Data Sources: International Satellite Cloud Climatology Project (ISCCP) weather state and FD flux data sets. Technical Description of Figures: Figure 1: Maps of the relative frequency of occurrence (RFO) for three tropical cloud regimes (CR) defined by the joint histograms of cloud top pressure and optical thickness to the left (the vertical colorbar indicates % occurrence within each bin). The RFOs come from 24 years (1984-2007) of ISCCP data. The three (out of eight in this region) cloud regimes chosen represent cloud mixtures dominated by deep convection (CR1), unorganized convection with large amounts of cumulus congestus (CR2) and marine stratocumulus (CR3). Figure 2: Annually and spatially averaged percent contribution to the tropical daytime SW TOA cloud radiative effect (CRE) against its LW counterpart for each cloud regime of the extended tropics from 24 years of ISCCP data. The dashed lines are lines of constant net % CRE contributions. The average SW and LW CRE % contributions occur at the intersection of the error bars which indicate seasonal variations of contributions. Scientific significance: Examining ISCCP’s near-global distribution (besides the tropics shown here we also examined northern and southern midlatitudes) of cloud regimes provides an opportunity to identify similarities and differences in their CREs and to rank them not only on the basis of CRE magnitude at the time of occurrence, but also in terms of relative contributions to the total CRE which is greatly influenced by their frequency of occurrence. In the tropics we found that the three most convectively active regimes are the ones with largest SW, LW and net TOA CRE contributions to the overall daytime tropical CRE budget. The boundary layer–dominated cloud regimes account for only 34% of the total SW CRE and 41% of the total net CRE, so to focus only on them in cloud feedback studies might not be wise. In the midlatitude zones we shown that only two cloud regimes, the first and third most convectively active with large amounts of nimbostratus-type clouds, contribute ~40% to both the SW and net TOA CRE budgets, highlighting the fact that regimes associated with frontal systems are not only important for weather (precipitation) but also for climate (radiation budget). Relevance for future science and relationship to Decadal Survey: Our understanding of how clouds contribute to the radiation budget of the planet needs to be improved. One way of achieving this is to combine cloud classifications from passive and/or active sensors with simultaneous broadband radiance/flux measurements. The observed relationships provide excellent higher-order diagnostics for climate models. The NPOESS Preparatory Project (NPP) and the restructured National Polar-orbiting Operational Environmental Satellite System (NPOESS), now JPSS (Joint Polar Satellite System) will have instruments that will allow such studies to be expanded and enhanced. Laboratory for Atmospheres
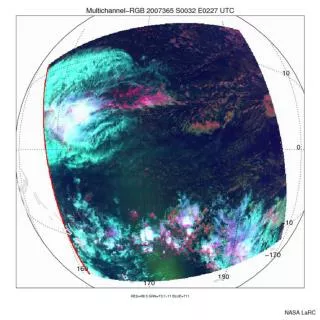
Ozone and Reactive Nitrogen in Arctic Free Troposhere Determined Primarily by Stratospheric Influx Qing Liang, Jose M. Rodriguez, Anne R. Douglass, Code 613.3, NASA GSFC Ozone in the Arctic troposphere is important as a surface pollutant affecting air quality and a greenhouse gas that contributes to Arctic warming. Currently there lacks a clear understanding of how each source, e.g. anthropogenic and biomass burning emissions and stratospheric intrusion, contribute to the ozone abundance in the Arctic troposphere. We analyze the aircraft observations obtained during the NASA ARCTAS aircraft mission to examine ozone and reactive nitrogen. The latter determines the production efficiency of ozone in the troposphere, in the Arctic and sub-Arctic region and their source attribution. We find: i) While anthropogenic, biomass burning, and convective air masses contain elevated NOx and hydrocarbons (precursors of O3), and display high O3 production rates, they do not contribute significantly to O3 in the Arctic troposphere. ii) Stratospheric air, when injected into the troposphere, is a major source of O3, NOx, as well as NOx reservoir species (HNO3, PAN) in the Arctic upper troposphere. The STE air masses is also the main driver of net ozone formation in the Arctic upper troposphere. Figure 1: Upper panels: Vertical profiles of O3, instantaneous net O3 production rates , NOx, and NOy (=NOx+PAN+HNO3) during ARCTAS-A, Spring 2008. Black lines show the mean 1-km binned values in background air masses sampled by the NASA DC-8 aircraft during ARCTAS-A. We highlight the individual air masses using color symbols: stratosphere (purple), Stratosphere-Troposphere Exchange (STE) (lilac), anthropogenic pollution (blue), biomass burning (green), and convection/lightning (yellow). The solid color lines indicate the vertical mean profiles of individual air masses. The lower panels are the same as the upper panels but for ARCTAS-B, Summer 2008, instead. Laboratory for Atmospheres
Name: Qing Liang, NASA/GSFC, Code 613.3, and UMBC GEST E-mail: Qing.Liang@nasa.gov Phone: 301-614-5993 References: Liang, Q., J. M. Rodriguez, A. R. Douglass, J. H. Crawford, E. Apel, H. Bian, D. R. Blake, W. Brune, M. Chin, P. R. Colarco, A. da Silva, G. S. Diskin, B. N. Duncan, L. G. Huey, D. J. Knapp, D. D. Montzka, J. E. Nielsen, J. R. Olson, S. Pawson, A. J. Weinheimer: Reactive Nitrogen, Ozone and Ozone production in the Arctic Troposphere and the Impact of Stratosphere-Troposphere Exchange, Atmospheric Chemistry and Physics Discussion, 11, 10721-10767, 2011. (under review for Atmospheric Chemistry and Physics) Data Sources: Aircraft measurements from the NASA ARCTAS field missions and the NASA GEOS-5 CO simulation for the ARCTAS mission. Technical Description of Figures: Figure 1: We compare the levels of O3, NOx, NOy, and calculated net ozone production rates in various air masses (anthropogenic pollution, biomass burning, convection, stratosphere-troposphere exchange) with those in the Arctic and sub-Arctic background tropospheric air. The combustion air masses (anthropogenic pollution and biomass burning) display elevated NOx, NOy (mostly in the form of NOx and PAN), and high net ozone production rates, but no significant elevation in O3 except a few biomass burning plumes in spring. Air masses associated with recent stratosphere-troposphere exchange with mean O3 concentration of 140-160 ppbv are the most important direct sources of O3 in the Arctic upper troposphere. Air of stratospheric origin is also significantly elevated in NOx and NOy. Driven by the high levels of NOx, these air masses display active net O3 formation and is the main driver of net O3 production in the Arctic free troposphere. Convection and/or lightning air masses, while display highly elevated NOx and ozone production rates, are negligible sources of O3 in the Arctic troposphere but can have significant impacts in the upper troposphere in the continental sub-Arctic during summer. Scientific significance: This analysis is of significant implication in understanding the sources and processes that control O3 abundance in the Arctic troposphere. Our results suggest that stratospheric air, when injected into the troposphere through stratosphere-troposphere exchange, is the dominant direct and indirect sources of O3 in the Arctic upper troposphere. This implies as the stratospheric O3 layer recovers in the coming decades, the O3 level in the Arctic troposphere is likely to increase and therefore increasing its contribution to the Arctic warming. Relevance for future science and relationship to Decadal Survey: This work clearly demonstrates the valuable information that aircraft measurements can provide to address important science questions, such as what controls the levels of ozone in the troposphere and therefore regulates the associated radiative forcing. Measurements from future aircraft field missions, e.g. SEACR4S, and the venture-class missions can also be used to improve our understanding of tropospheric and stratospheric chemistry. Laboratory for Atmospheres