Download
1 / 10
100 likes | 248 Vues
The New Zealand Attitudes and Values Study (or how to survive starting your own longitudinal sample).

E N D
The New Zealand Attitudes and Values Study(or how to survive starting your own longitudinal sample) Chris G. Sibley, Lara Greaves, Joseph Bulbulia, Danny Osborne, Fiona Kate Barlow, Carla Houkamau, Petar Milojev, Yanshu Huang, Nikhil Sengupta, Sam Manuela, Geoff Troughton, Marc Wilson, Nickola Overall, Matthew Hammond, Emerald McPhee, Gloria Fraser, Lucy Cowie, Samantha Stronge, Taciano Milfont, John Duckitt, Carly Townrow, James Liu, Tim West-Newman, Jessica Harding, Ryan Perry, and many more. www.psych.auckland.ac.nz/uoa/NZAVS The NZAVS is currently supported a Templeton World Charity Foundation Grant (ID: 0077) and a Marsden Fund grant.
What is the NZAVS? • The New Zealand Attitudes and Values Study (NZAVS) is a 20-year longitudinal national probability study of social attitudes, personality and health outcomes. The NZAVS is unique to New Zealand. • The NZAVS is a team effort and involves researchers from a range of universities and diverse disciplines. Members of the NZAVS research team at our annual meeting (30 August 2013)
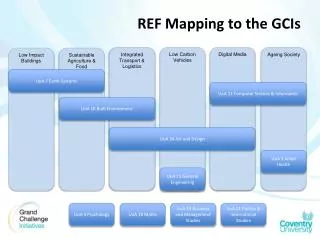
The NZAVS: Our Aims • Answering big questions about change and stability that require long-term longitudinal and multilevel data capturing change and stability in both people and neighbourhoods. • Building infrastructure for longitudinal research and data analysis in New Zealand. • Providing independent (and free) data and expert analysis on socially relevant issues in New Zealand to policy makers and health professionals. • Providing data from New Zealand for larger collaborative cross-cultural research. • Leaving something long-term that will be of use for future generations of researchers in New Zealand. Image from CarvinSteetwear – NZ – Federation. http://www.carvinstreetwear.com/brands/federation/federation-i-call-new-zealand-home-2.html
What is the NZAVS? • Random sample of registered voters for the NZ Electoral Roll • Time 1: 6,518 (16.6% response rate) • Time 2: 4,442 • Time 3: 6,884 (booster sample 2,965) • Time 4: 12,183 (booster: 5,378). • Time 5: ongoing, ~6000 retained. • At Time 4, we retained 4051 (62.2%) of people from Time 1. And we retained 5,762 (83.7%) of participants from Time 3. • 3089 people have completed all 4 time points. • Has generated 44 publications to date. Approximate location of participants (based on meshblock centroids).
A typical day’s mail (04-April-2014) Response timeline for waves 1-4
What is the NZAVS? Comparison of men and women in the T4 (2012) NZAVS and 2013 New Zealand Census Comparison of ethnic affiliation in the T4 (2012) NZAVS and 2013 New Zealand Census Comparison of distribution across region in the T4 (2012) NZAVS and 2013 New Zealand Census
Postal + email Phoning Prize draws Xmas cards Pamphlet Social Media Press releases Webpage $1 to charity
What do we measure? • Self-report measures.Numerous demographics, intergroup contact, ambivalent sexism, racism, personality, perceived discrimination Kessler-6, psychological distress, disease and health diagnoses, ethnic-identity, political attitudes, self-efficacy, religious attitudes, social support, subjective wellbeing, health ratings, policy attitudes, environmental attitudes, beliefs about climate change, experiences of the Christchurch earthquake, subjective deprivation, prejudice, relationship breakup, becoming a parent, etc… • Regional measures. These are measures based on meshblock and area unit information from the census. Regional deprivation, regional inequality (our own Gini proxy) proportion of ethnic groups, proportion of religious people, distance and height above coastline, proportion of smokers and married people, proximity to green space, etc.
How does it all happen? • Design phase for each year. People make a case for what we should rotate in and out each year. This process takes about 6 months or so. • Questionnaires arrive, decollated, matched to sample frame id, each page given a unique stamp, consent forms removed, entered, scanned, encrypted, then originals shredded. (plans for a video training session). • Responses matched to previous participant database (harder than you might expect), matched to most recent electoral roll, mesh block codes identified. Demographics coded using NZ census statistical standards. • Anonymized data shared within research group, encrypted and anonymous data files stored on our own server and backed up on our RAID. Encrypted backups also stored with other researchers off-site. • Analyses are run on our server using Mplus. Mplus script files for analyses stored centrally on our server. We hold regular statistical workshops to share our analyses and what we are working on. (Our first official conference and associated conference proceedings will be held later this year). • Some examples of the methods we use are Bayesian structural equation models, latent growth models, non-stationary Markov models, multilevel-random coefficient models, mixture models such as latent profile analysis, and so on… • Technical details posted online. Mplus syntax for published papers is posted on our website. Detailed technical information about the sample frame, respondents, representativeness relative to census, and planning documents posted on our website. The NZAVS lab. (Lara coding data. Chris pretending to code data for the photo).
Where to next? • Short term: Finish data collection for Time 5, conduct a final large booster sample of 70,000 people. • Medium term: Finalize the design for Time 6 and 7. Introduce a $1 donation scheme for each returned survey. Start the NZAVS Family Focus Questionnaire • Long-term: A focus on outcomes for Christchurch. Find a way for the study survive and secure longer-term funding past Wave 7. • Develop new collaborations Desktop background for the NZAVS server. Photo of a kea in the wild drinking coffee near Arthur’s pass. Photo by Danny Osborne. (Coffee was not supplied).