Download
1 / 47
470 likes | 496 Vues
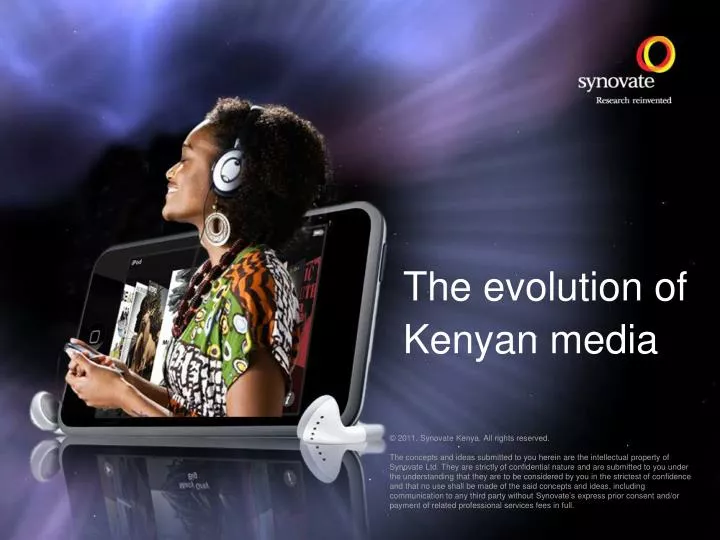
The evolution of Kenyan media. Project #:. 000000. Metro FM Vs Capital FM 1997. DAILY RADIO TRENDS IN TOTAL SURVEY AREA – MONDAY AM. Market Development. Kenya populations grows rapidly. Kenya 38.6 Million 2009.

E N D
The evolution of Kenyan media Project #: 000000
Metro FM Vs Capital FM 1997 DAILY RADIO TRENDS IN TOTAL SURVEY AREA – MONDAY AM
Kenya populations grows rapidly Kenya 38.6 Million 2009 The rapid population growth has provided opportunities to develop brands and media. The media offering has grown rapidly since the liberalization of the airwaves in 1996 in line with the rapidly increasing population and economic development.
Kenya’s Gross Domestic Product per Capita in US$ The increase of the GDP has led to a more affluent population, improving the business prospects for products and services, and therefore a vibrant advertising and media industry. The masses can now afford more goods now than before due to increased income and reduced prices driven by competition. Their living standards have therefore improved.
Kenya is more urban than 12 years agoDemographic changes 1999 Vs 2011 • Urban tastes expected to increase • Entertainment content increases in popularity • Stations that do well in urban areas perform better nationally with increased urbanization
Kenyans become more affluentLSM comparisons between 2007 & 2011
Geographic media proliferation influences the diverse media habits across the country The number of broadcast media stations has grown significantly since the liberalization of the airwaves in 1996. Advertising expenditure has grown in line with this, creating an environment that supports the dynamic sector. Number of radio & TV stations in Kenya
Regional Advertising Exposure (US$) 2006 to 2010 Sub-Saharan Africa experience 20% growth of advertising expenditure year on year; the highest growth rate in the world (World Advertising Research Corporation). This is attracting major advertising agency players and media houses into the region in an effort to tap into this growth. Advertiser have increase options to reach their target audiences at better rates of return due to the increased competition in the media sector .
Radio is universal, internet use grows Media incidence Past 4 Weeks & Past 7 Days Past 4 weeks incidence of Radio, TV and Internet increase while Print shows a decline. Internet shows the biggest rise due to the mobile telephony and the penetration of smart phones and internet enabled handsets. Mobile phone are not a luxury anymore, and the internet is clearly headed in that direction! Base: 22.0m
Differentiated content drives fragmentation People are listening to fewer radio stations than they were 3 years ago, though watching more TV stations. Most new radio stations have taken a copy and paste approach, yet those media brands that broadcast or publish differentiated content that appeals to the audiences tend to get the biggest share of ratings and advertising expenditure.
Differentiated content has also driven fragmentation in the print media Dual print readers are significant in proportion to the whole due to the introduction of titles that are differentiated with niche target groups. There are 2 additional titles and there are many more sections and inserts in the existing dailies.
Incidence of listening to vernacular stations by LSMs 2007 Our research showed that vernacular radio was popular regardless of the LSM. It was previously thought that the higher LSMs only listened to English stations This information led to the proliferation of vernacular radio stations across the country which have quickly gained popularity in the specific regions that they target. Base : Total Sample per LSM
Research shows the significance of Swahili listening in the country Swahili is a universal language that transcends topographies and therefore the Kiswahili stations tend to capture large audiences. This insight led to the introduction of new Kiswahili radio stations that are now have the dominant audiences.
Top 10 Radio Stations – P7D 2011 Kiswahili radio stations lead in audience levels, while vernacular radio stations have gained in popularity over the years.
MEDIA LANDSCAPEThe 2007 establishment survey uncoveredMedia topographies
KARF 2011 Media Topographies The discovery of media topographies has significantly changed the way media is planned in the country. Media planners buy regionally and then fill in with national stations, as opposed to previously when they bought nationally and filled in with regional stations.
KARF 2011 Media TopographiesChanges between 2007 & 2011 The media landscape has been shifting over time. With the rapid growth of radio stations there was subsequent fragmentation in listenership. This was followed by a reduction in geographical fragmentation due to stations increasing their broadcast footprint, enhanced marketing and awareness campaigns. There are 12 media topographies, down from 16 in 2007 Topographies are homogenous media consumption regions in the country. 2007 16 Topos 2011 12 Topos
Greater Nairobi Topography Top 5 Radio Stations Reach Share of Time Spent Listening by Main Language of Broadcasting Per capita radio listening data Average # of radio stations listened to per week=3.8 Average # of hrs spent listening to radio per day=4.5
Central Topography Top 5 Radio Stations Reach Share of Time Spent Listening by Main Language of Broadcasting Per capita radio listening data Average # of radio stations listened to per week=3.5 Average # of hrs spent listening to radio per day=5.4
Radio stations using research in their business strategy 2003 Even though Metro FM was one of the first FM stations in the country, they were quickly overtaken by Kiss FM who used research to develop programming that was appealing to the majority.
Music pulls audiences to FM stations Kiss FM also used a differentiated approach to their programming namely Hit Radio format, while all other FM stations were doing the Adult Contemporary format. This was driven by the research finding that people were attracted to certain types of music in the FM stations.
Station positioning proven by research Nairobi radio stations social class profiles Capital FM established a position in the market as the Up Market radio station, a position which they have held since. The research was able to prove this positioning as seen in 2003 when they clearly led with higher proportions of high income groups.
Cost of radio drops with increased competition Media research has been used to justify the rate card hikes, but audiences have been growing faster than the rate increases. Increased competition for advertising shillings has led to a decrease in cost per thousand. This means that media has become cheaper over time, irrespective of increases in the gross rate card.
KBC local comedies were very popular in 2002 2002 MOVIE VIOJA MAHAKAMANI KTN LEO BROKEN VOWS KTN PRIME NEWS NATION AT 9 MIZIZI HABARI
Channel time allocation & time spent viewing by local, African, international content Share of time allocated by genre Share of time spent viewing by genre
Genre time allocated Vs time spent viewing overall News continues to attract large share of the viewing, while soap operas show a lot of potential. Other genres with potential are dramas, religious, reality and comedy shows.
Sports programming • Our insights showed that sports is popular on TV and especially soccer. • K24 used this insight to purchase and air the English Premier League, and this resulted in a dramatic rise in their time spent viewing. • From our insights it is clear that there is still a lot of potential in sports programming.
57% of Kenyan viewers watch sports on TV What sports do you watch on TV K24 benefited from airing the English Premier league in Q1 2010 Base: Those who watch sports on TV
Newspaper readership incidence & profile by LSM Readership Incidence and profile by LSMs Incidence profile 81% 58% 36% 31% 24% 36 9% 12%
Newspapers read in the Past 7 Days • Total readers • Daily: 3,001,120 • Weekly: 6,008,487 • Monthly: 10,517,232 Despite the popularity of Kiswahili language, the popular print titles are the English language ones. Base: Past 7 days newspaper readers
Past 7 Days media activities. Q1 2011 Mobile phones now rival the access to radio, and shows it’s potential as a media. There are more people who made a phone call using a mobile phone in the past 7 days that those who’ve watched television or read a newspaper. These results have led to companies exploring various mobile and internet advertising strategies as they are considered the media of the future.
Where do you access Internet from? Base: 3.6m (Past 4 weeks Internet Users) Base: 3.6m (Past 4 weeks Internet Users)
Mobile internet is the way of the future • Majority of people who access the internet use their mobile phones to do so. • This is especially true with the younger generation, and this trend will continue into the future as they get older. • Mobile advertising has to fit comfortably on the smart phone screen, and has to be adapted to be interactive in the way that the platform allows.